Fig. D.2
Download original image
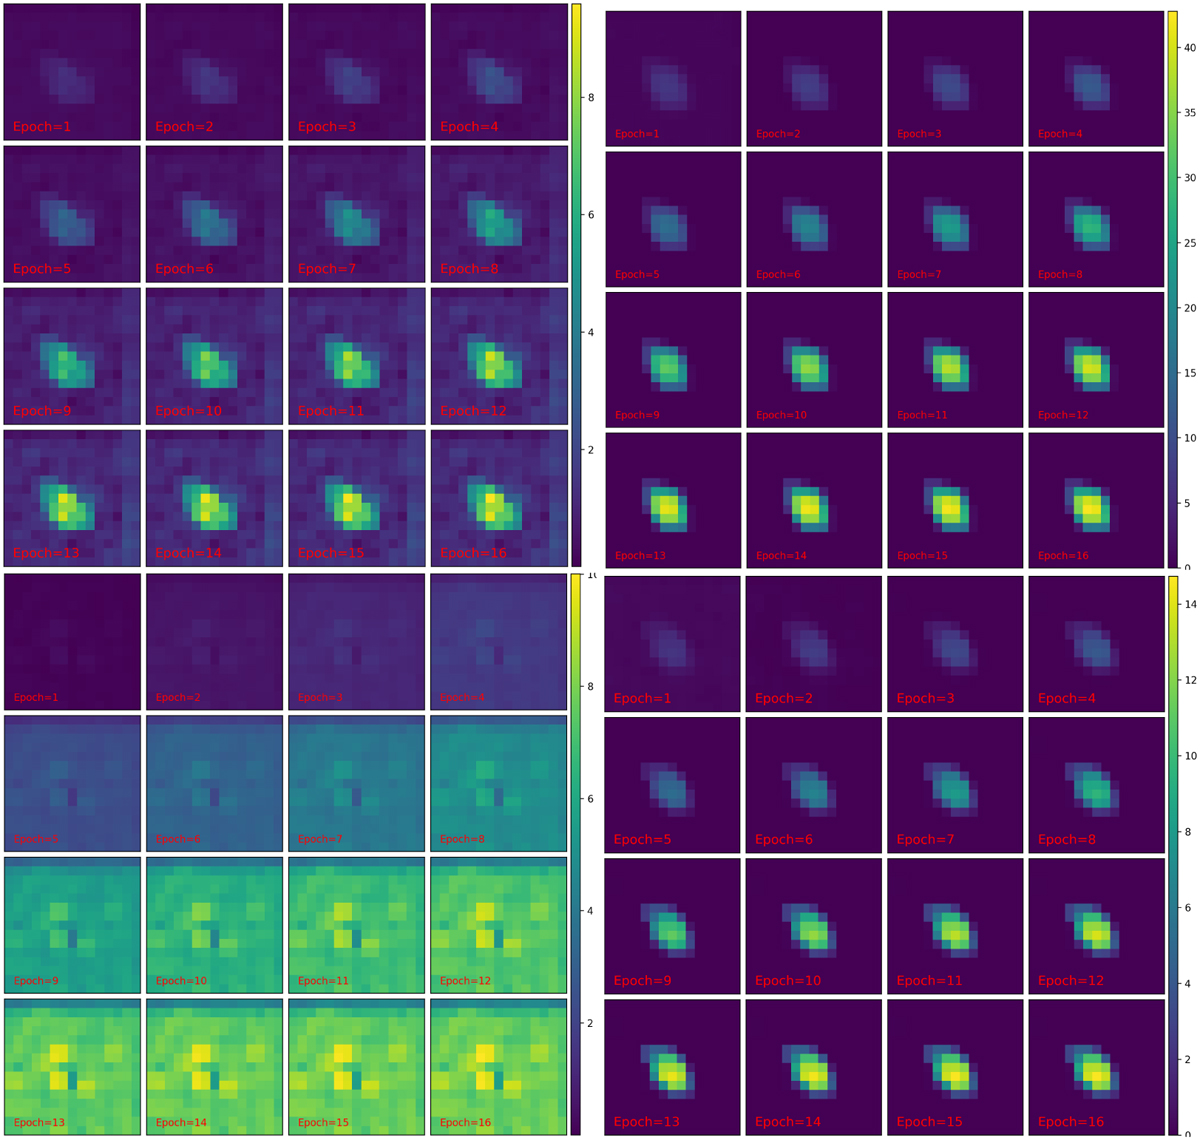
Feature maps extracted by the SS-3D-Clump model from molecular clump-positive samples at each training epoch are shown. The figure displays the variations of four feature maps over 16 epochs. The bottom-left subplot represents background noise information. The top-right subplot captures the intensity of the molecular clump, reaching an integrated intensity of approximately 40 after 16 epochs, while the other three feature maps have intensities of around 10. The bottom-right subplot may contain directional information in the l − b direction. The top-left subplot includes the main components of the molecular clump and background noise.
Current usage metrics show cumulative count of Article Views (full-text article views including HTML views, PDF and ePub downloads, according to the available data) and Abstracts Views on Vision4Press platform.
Data correspond to usage on the plateform after 2015. The current usage metrics is available 48-96 hours after online publication and is updated daily on week days.
Initial download of the metrics may take a while.