Fig. C.1
Download original image
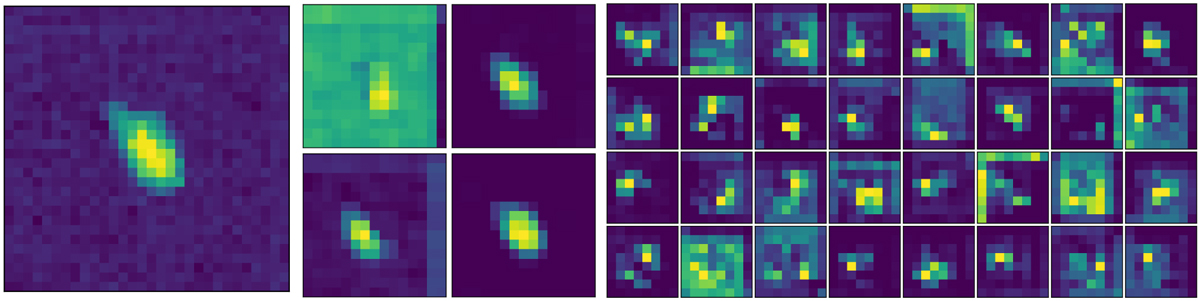
Features extracted from the SS-3D-Clump model for positive samples of molecular clump are shown. The left subplot represents the integrated map of the molecular clump in l − b. The middle four subplots arranged in a 2 × 2 grid depict the feature maps obtained after the ‘Stem’ feature extraction in the SS-3D-Clump model (16 feature maps, with four shown here). These feature maps capture the main components of the molecular clump and background noise. The right side exhibits 32 subplots showing the features extracted through the ‘ResB 1’ operation in the SS-3D-Clump model.
Current usage metrics show cumulative count of Article Views (full-text article views including HTML views, PDF and ePub downloads, according to the available data) and Abstracts Views on Vision4Press platform.
Data correspond to usage on the plateform after 2015. The current usage metrics is available 48-96 hours after online publication and is updated daily on week days.
Initial download of the metrics may take a while.