Open Access
Fig. 13
Download original image
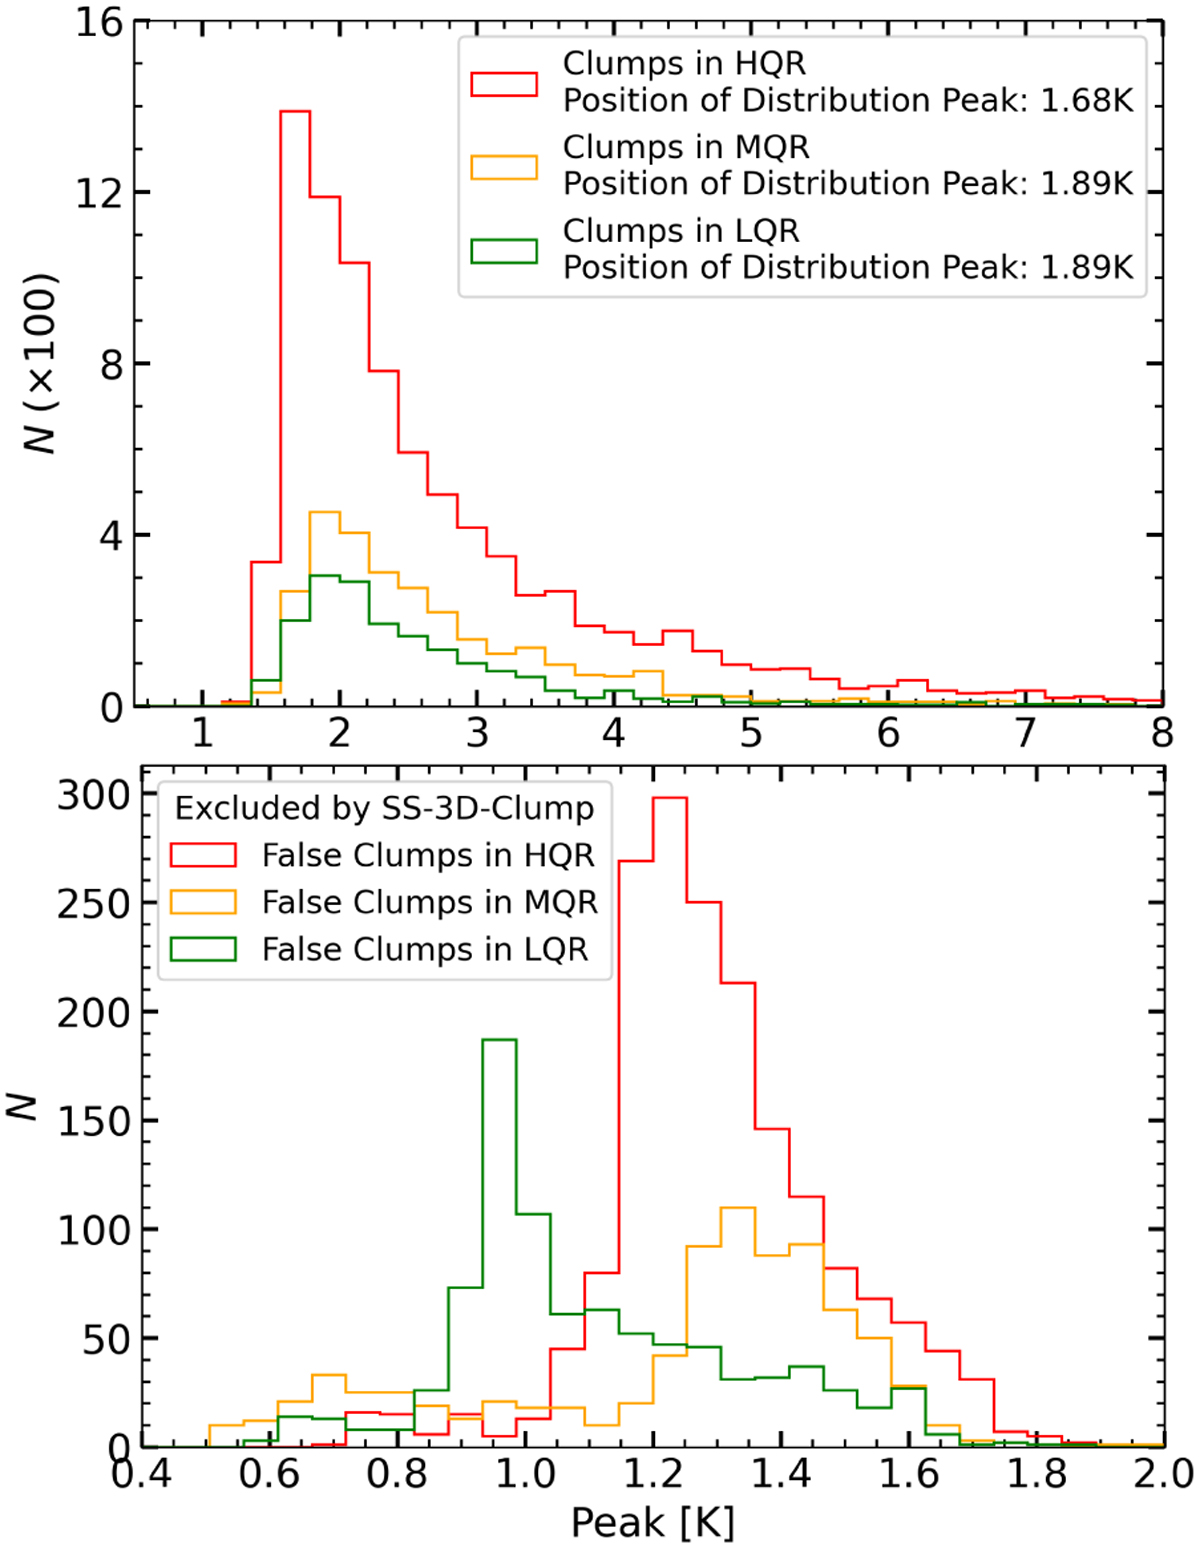
Peak distribution of clumps excluded and retained by SS-3D-Clump. Top: peak distribution of clumps in the three regions. The peak positions of the distributions in LDR and MDR are consistent at 1.89 K, while in HDR, the peak position is at 1.68 K. Bottom: peak distribution of clumps excluded by the final SS-3D-Clump.
Current usage metrics show cumulative count of Article Views (full-text article views including HTML views, PDF and ePub downloads, according to the available data) and Abstracts Views on Vision4Press platform.
Data correspond to usage on the plateform after 2015. The current usage metrics is available 48-96 hours after online publication and is updated daily on week days.
Initial download of the metrics may take a while.