Fig. 7
Download original image
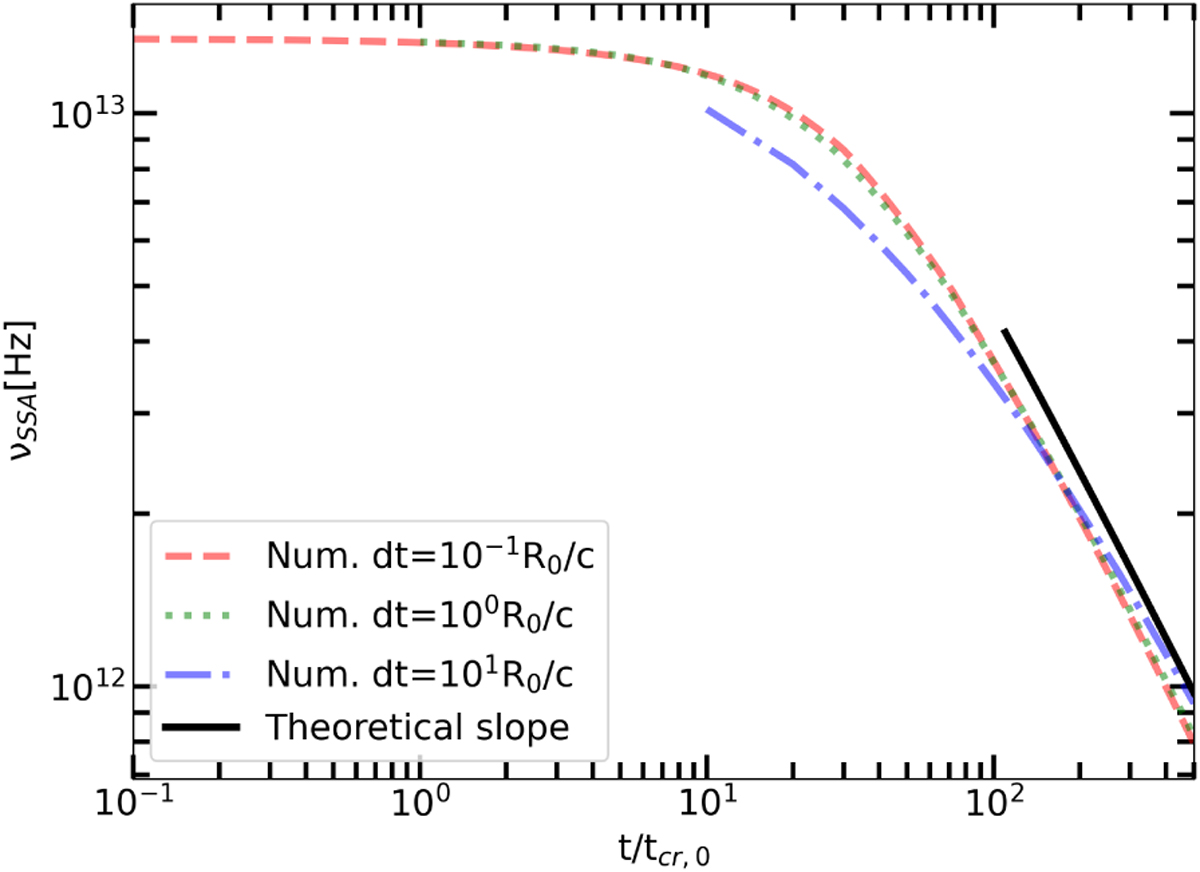
Evolution of the synchrotron-self absorption frequency vssa with time for the same case shown in Fig. 5. Different types of lines show vssa as derived from the numerical solutions for different choices of the time step (see inset legend). For comparison, we show the analytical prediction for the late-time (t ≫ R0 /Vexp) evolution of vssa with time.
Current usage metrics show cumulative count of Article Views (full-text article views including HTML views, PDF and ePub downloads, according to the available data) and Abstracts Views on Vision4Press platform.
Data correspond to usage on the plateform after 2015. The current usage metrics is available 48-96 hours after online publication and is updated daily on week days.
Initial download of the metrics may take a while.