Fig. 6
Download original image
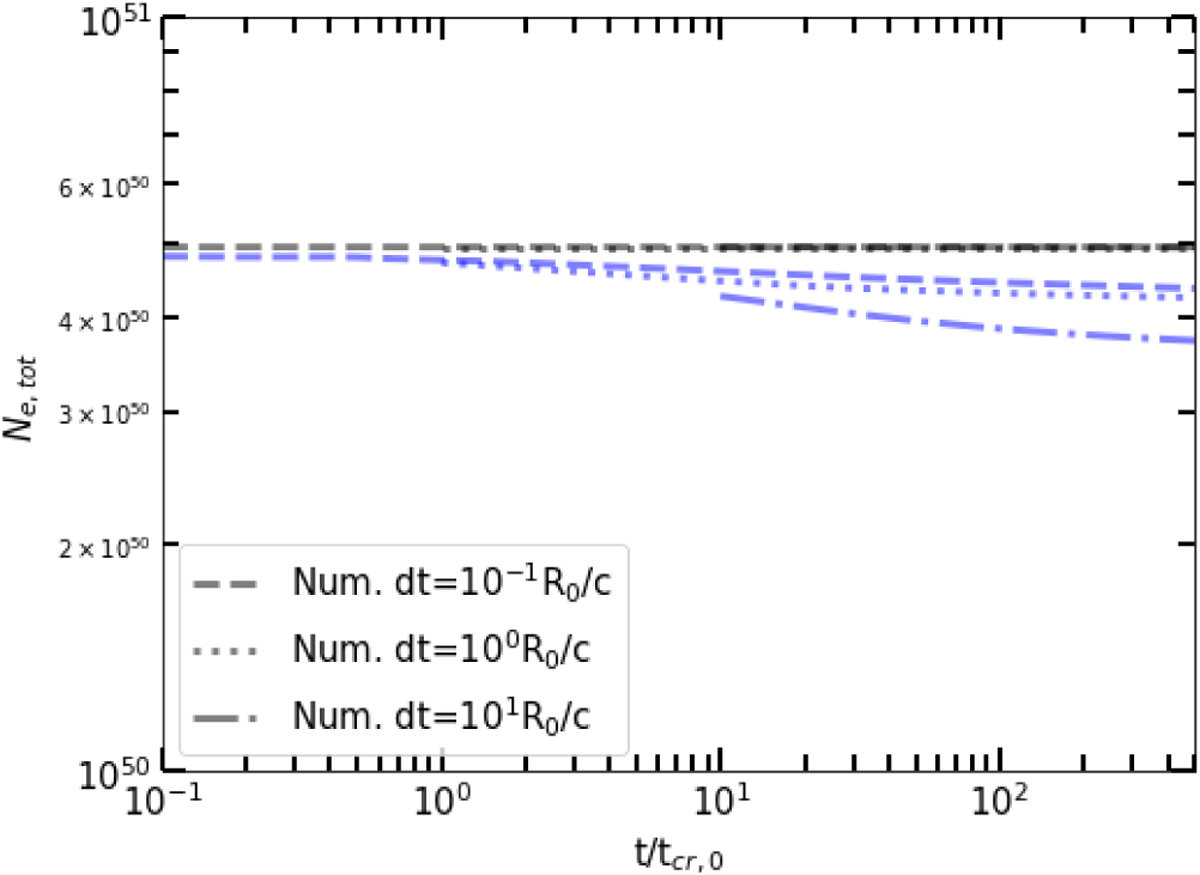
Evolution of the total number of particles Ne with time for the same case shown in Fig. 5. Different types of lines show Ne as derived from the numerical solutions for different choices of the time step (see inset legend). The black lines represent the number of particles calculated by considering all grid points, while the blue lines represent the integration of the particle distribution within the analytically expected range of Lorentz factors, i.e. γe,min(t) and γe,max(t). For comparison, the analytical solution yields Ne,tot = 4.9 × 1050 electrons.
Current usage metrics show cumulative count of Article Views (full-text article views including HTML views, PDF and ePub downloads, according to the available data) and Abstracts Views on Vision4Press platform.
Data correspond to usage on the plateform after 2015. The current usage metrics is available 48-96 hours after online publication and is updated daily on week days.
Initial download of the metrics may take a while.