Fig. C.2
Download original image
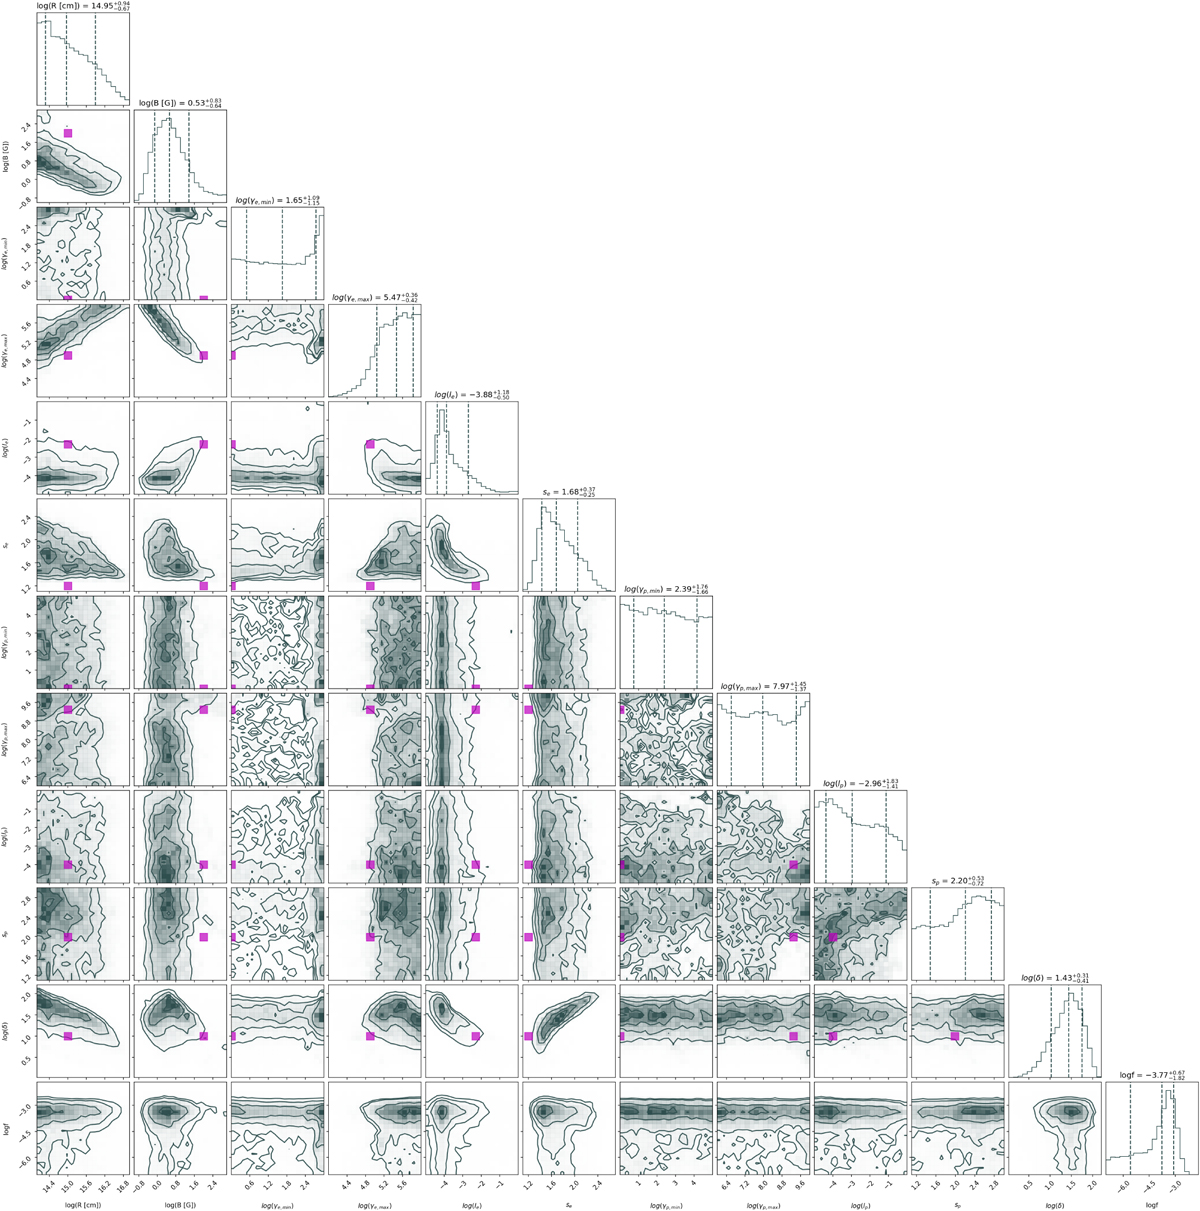
Corner plot showing the posterior distributions of the parameters of the PS model of 3HSP J095507.9+355101. Dashed lines in the histograms indicate the median value of each parameter and the 68 % range of values. The parameter values used in the PS from Petropoulou et al. (2020) are overplotted (magenta square) for comparison.
Current usage metrics show cumulative count of Article Views (full-text article views including HTML views, PDF and ePub downloads, according to the available data) and Abstracts Views on Vision4Press platform.
Data correspond to usage on the plateform after 2015. The current usage metrics is available 48-96 hours after online publication and is updated daily on week days.
Initial download of the metrics may take a while.