Fig. 13
Download original image
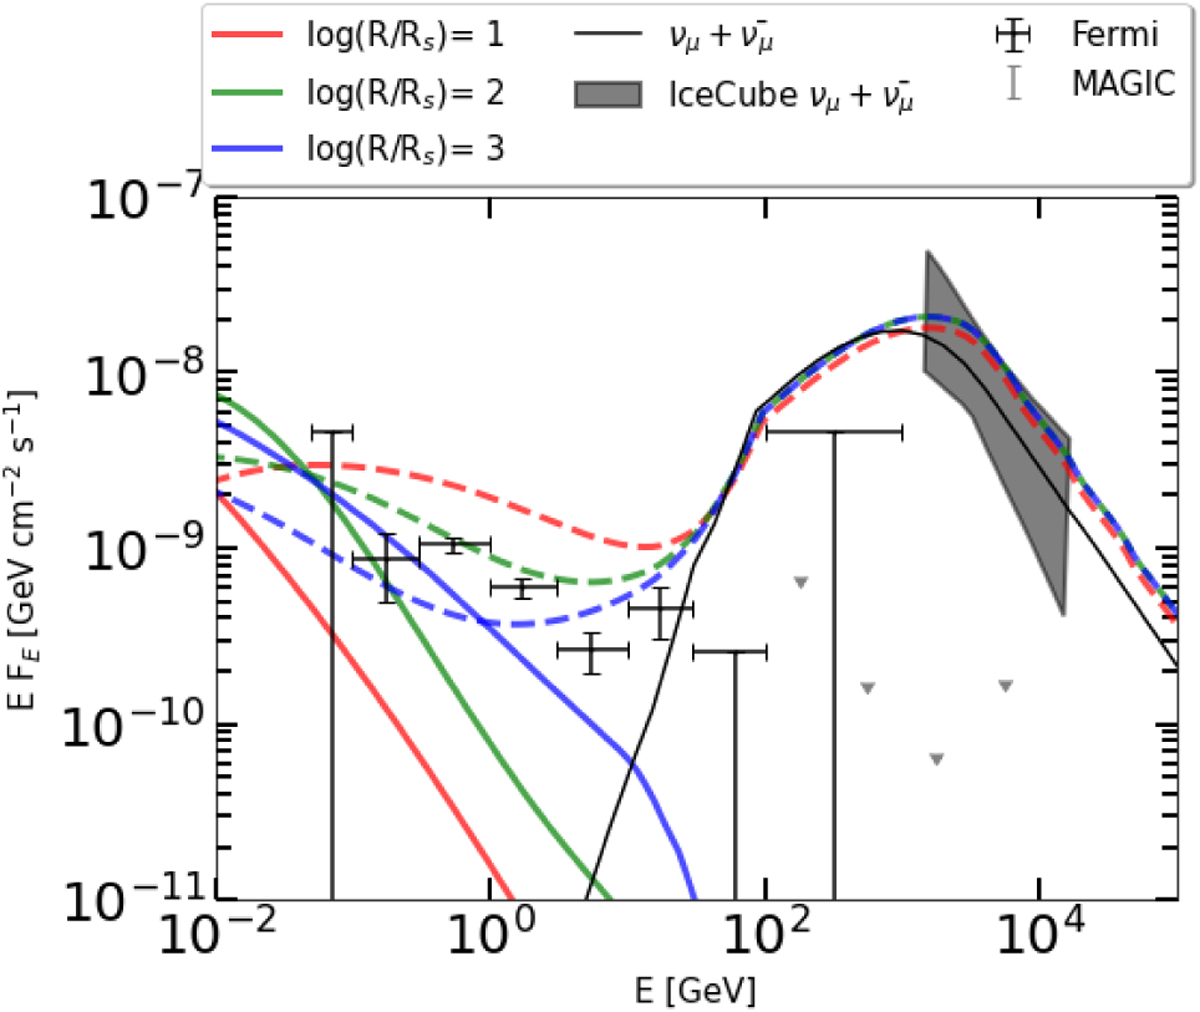
γ-ray and neutrino emission of NGC 1068. Black symbols and grey arrows indicate γ-ray measurements by Fermi-LAT (Abdollahi et al. 2020) and upper limits by MAGIC (Acciari et al. 2019), respectively. Colored solid (dashed) lines represent the γ-ray spectrum produced by the electromagnetic cascade inside the corona with (without) γγ absorption respectively, for different choices of radius and magnetic field (see legend and text for details). The solid dark line represents the muon and anti-muon neutrino spectrum, and the grey-shaded region covers all power-law neutrino fluxes that are consistent with the IceCube data at 95% confidence level (IceCube Collaboration 2022).
Current usage metrics show cumulative count of Article Views (full-text article views including HTML views, PDF and ePub downloads, according to the available data) and Abstracts Views on Vision4Press platform.
Data correspond to usage on the plateform after 2015. The current usage metrics is available 48-96 hours after online publication and is updated daily on week days.
Initial download of the metrics may take a while.