Fig. 12
Download original image
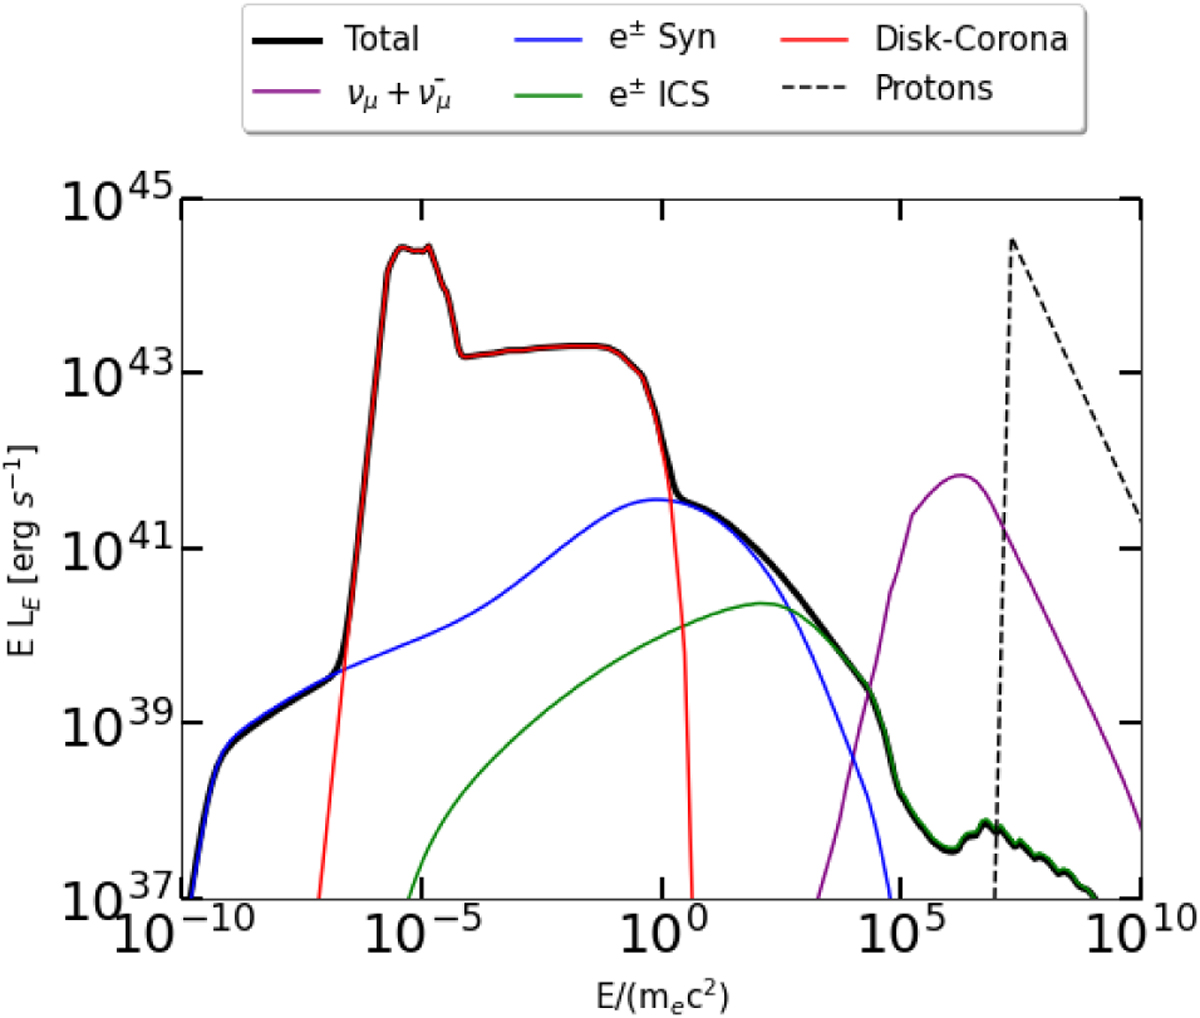
Spectral energy distribution of NGC 1068 is analyzed by considering an emitting region with R = 100 Rs. The total photon spectrum originating from this region is shown by the solid black line. The solid red line represents the combined contribution of the corona and disk components (template adopted from Murase et al. 2020). Solid blue and green lines represent the synchrotron and ICS emission produced by the secondary particles, respectively. The neutrino spectrum is depicted by the purple line, and the black dashed line represents the injected luminosity of protons.
Current usage metrics show cumulative count of Article Views (full-text article views including HTML views, PDF and ePub downloads, according to the available data) and Abstracts Views on Vision4Press platform.
Data correspond to usage on the plateform after 2015. The current usage metrics is available 48-96 hours after online publication and is updated daily on week days.
Initial download of the metrics may take a while.