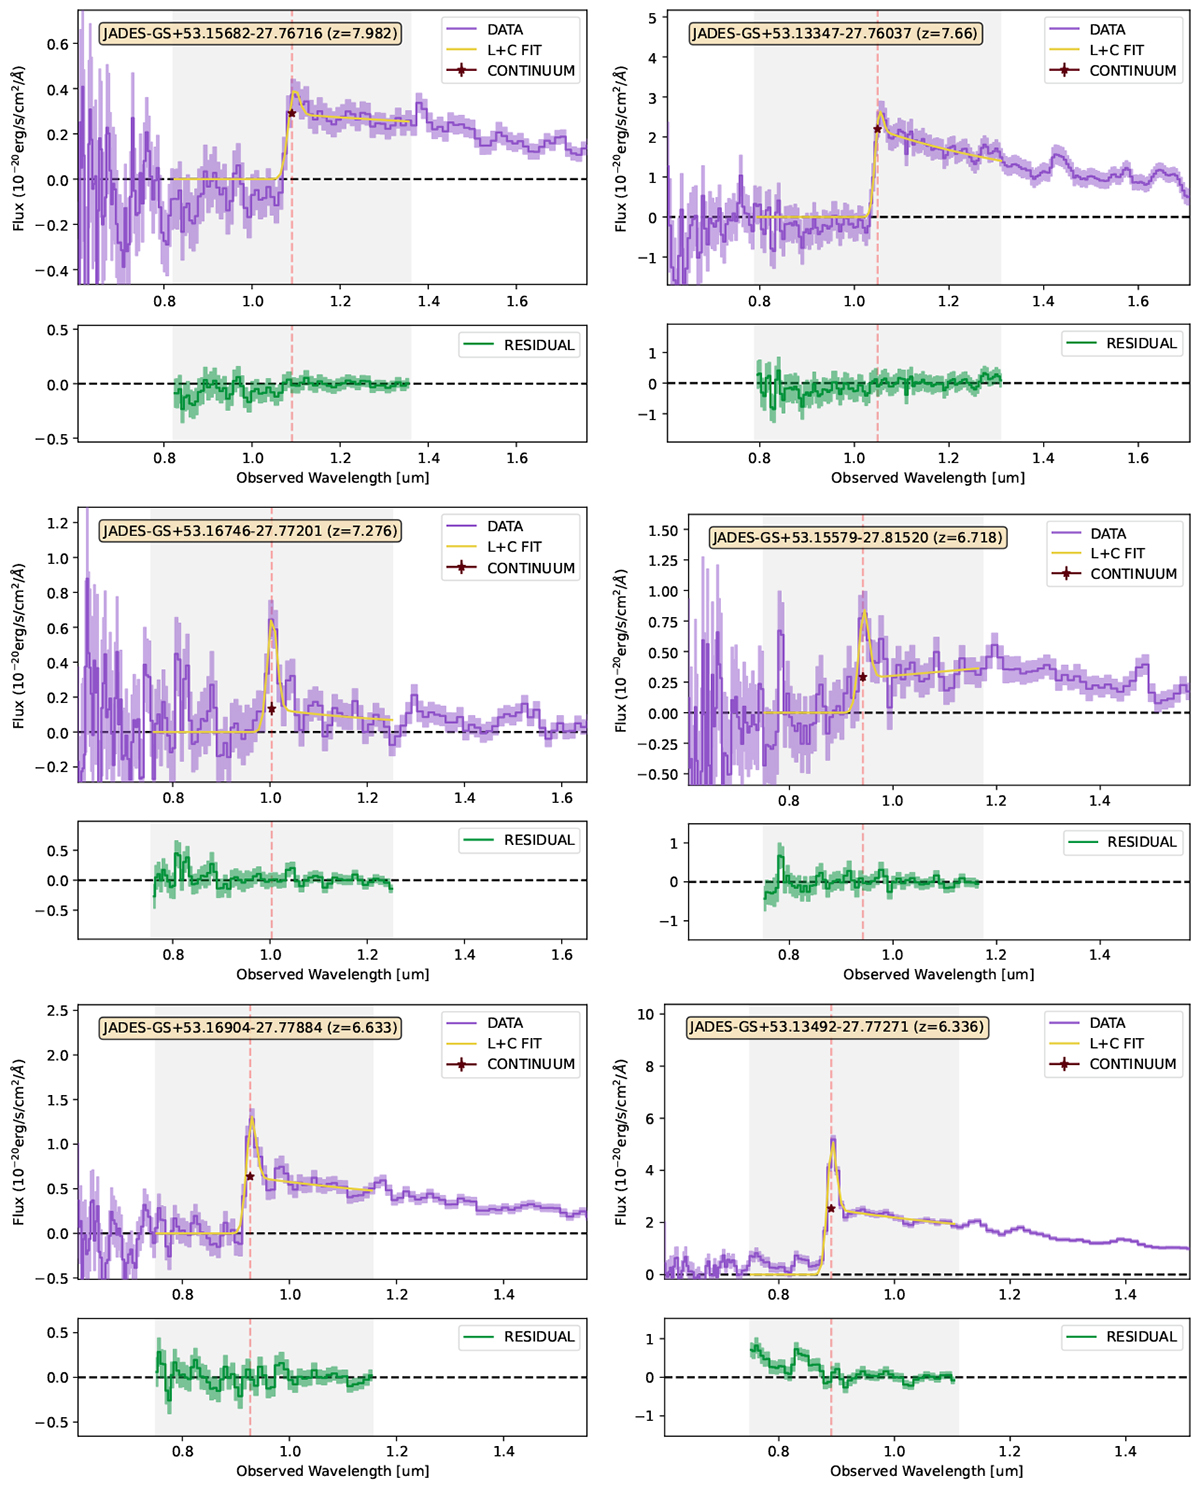
Fig. 2.
Download original image
Results of fitting a line plus continuum model to observed JADES R100 data, for sources detected in Lyα emission (denoted by “L+C FIT”). In each top panel, we show the observed spectrum (purple line) with an associated 1σ error (shaded region). The best-fit model, which includes the effects of the LSF, is shown by a yellow line. Fitting was performed using the wavelength range that is shaded grey. The continuum value at the redshifted Lyα wavelength is represented by a brown star. The bottom panel shows the residual. Continued in Fig. A.1.
Current usage metrics show cumulative count of Article Views (full-text article views including HTML views, PDF and ePub downloads, according to the available data) and Abstracts Views on Vision4Press platform.
Data correspond to usage on the plateform after 2015. The current usage metrics is available 48-96 hours after online publication and is updated daily on week days.
Initial download of the metrics may take a while.