Fig. 1.
Download original image
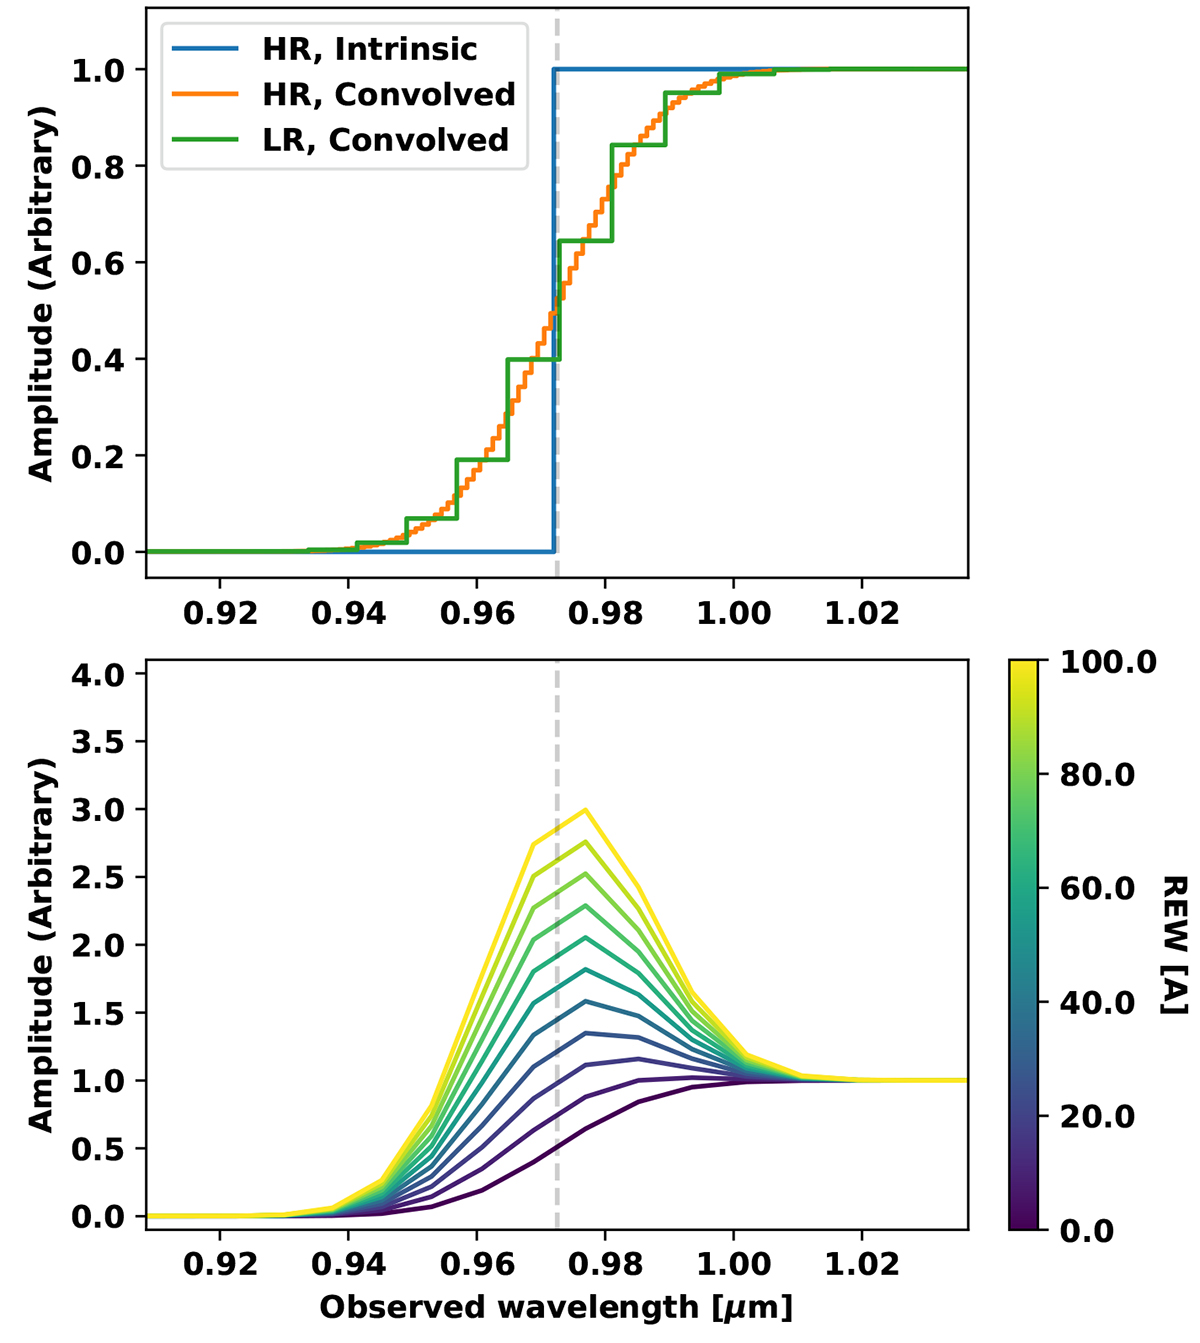
Demonstration of how Lyα break and emission for a source at z = 7 are affected by the low resolving power of our observations. The top panel shows how a step function (blue line) is affected by the resolving power on a high-resolution (Δλ = 0.001 μm) spectral grid (orange curve), and how this curve would appear on the R100 spectral grid (green steps). If we add Lyα emission with a given REWLyα in the first high-resolution spectral bin redwards of the break and then account for the LSF and R100 spectral bin, we find the curves in the lower panel.
Current usage metrics show cumulative count of Article Views (full-text article views including HTML views, PDF and ePub downloads, according to the available data) and Abstracts Views on Vision4Press platform.
Data correspond to usage on the plateform after 2015. The current usage metrics is available 48-96 hours after online publication and is updated daily on week days.
Initial download of the metrics may take a while.