Open Access
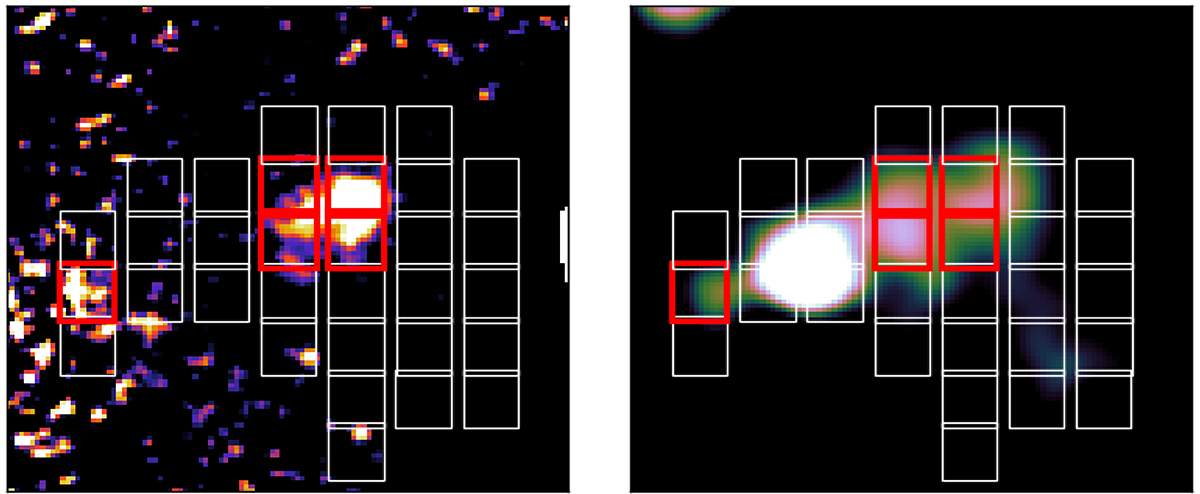
Fig. C.1.
Download original image
Left: residuals of the X-ray emission, obtained by dividing the observation for the model of the X-ray emission. The minimum of the colour scale is set to log(data/model) = 0.2. Right: LOFAR radio image of the halo region. The red cells of the grid correspond to the five points with log(data/model) > 0.2.
Current usage metrics show cumulative count of Article Views (full-text article views including HTML views, PDF and ePub downloads, according to the available data) and Abstracts Views on Vision4Press platform.
Data correspond to usage on the plateform after 2015. The current usage metrics is available 48-96 hours after online publication and is updated daily on week days.
Initial download of the metrics may take a while.