Fig. 5.
Download original image
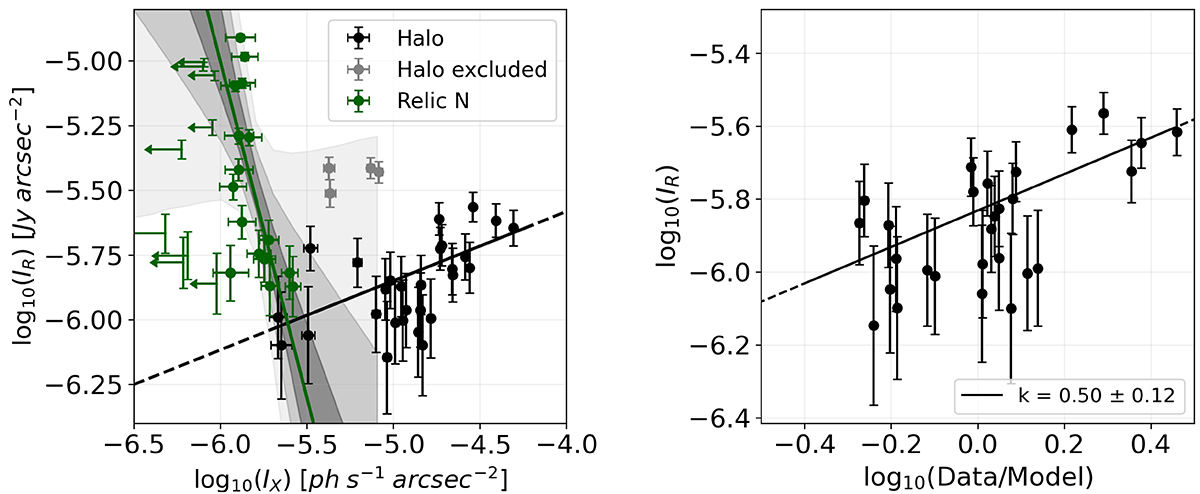
Correlations between the X-ray and radio properties. Left: correlations between IR and IX computed in the halo (black) and northern (green) relic regions using the meshes shown in the subplots of Fig. 1. Grey points correspond to the cells excluded from the halo analysis (see Sect. 3.3). The slopes and Spearman and Pearson coefficients measured are reported in Table 1. The shadowy regions represent the scatter of the relic correlation (from dark to light grey, 1, 2, 3σ). Right: the correlation between the radio emission and the X-ray residuals.
Current usage metrics show cumulative count of Article Views (full-text article views including HTML views, PDF and ePub downloads, according to the available data) and Abstracts Views on Vision4Press platform.
Data correspond to usage on the plateform after 2015. The current usage metrics is available 48-96 hours after online publication and is updated daily on week days.
Initial download of the metrics may take a while.