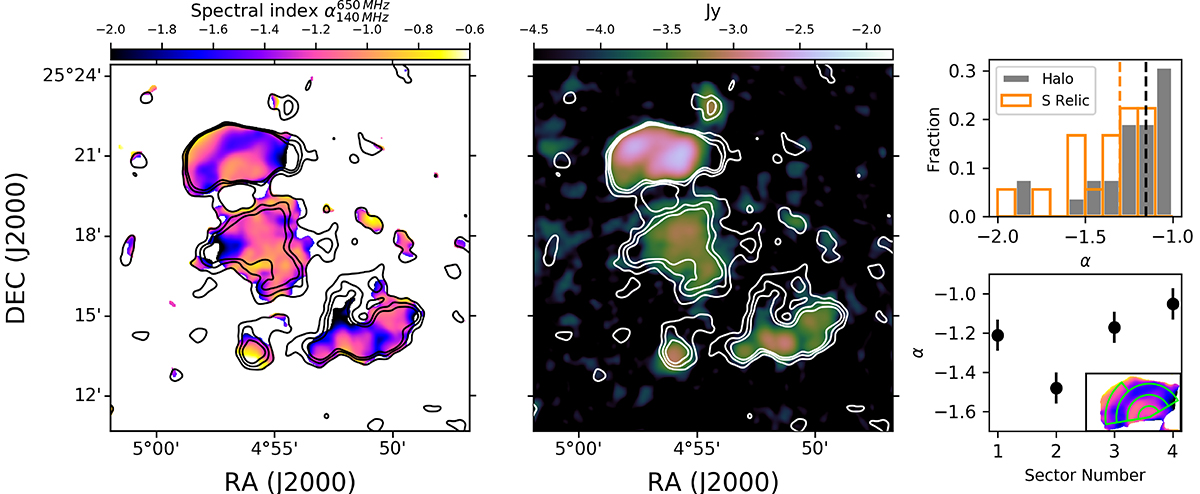
Fig. 3.
Download original image
Analysis of the radio emission of G113. Left: spectral index map of the cluster G113, with LOFAR contours of the image at 35″ × 35″ overplotted ([−3, 3, 6, 9, 12] × σ, with σ = 0.37 mJy beam−1). Centre: uGMRT image of G113, with LOFAR contours overplotted. The resolution of the image is 35″ × 35″ and the rms noise is σ = 0.037 mJy beam−1. Right top: distribution of the spectral index extracted from square-shaped boxes of width 35″ in the halo (grey) and southern relic (orange) regions. The vertical lines represent the α median values for the halo (black) and relic (orange). Right bottom: values of α extracted from the sector shown in the subplot. The sectors are numbered from the outer annulus (1) to the inner one (4).
Current usage metrics show cumulative count of Article Views (full-text article views including HTML views, PDF and ePub downloads, according to the available data) and Abstracts Views on Vision4Press platform.
Data correspond to usage on the plateform after 2015. The current usage metrics is available 48-96 hours after online publication and is updated daily on week days.
Initial download of the metrics may take a while.