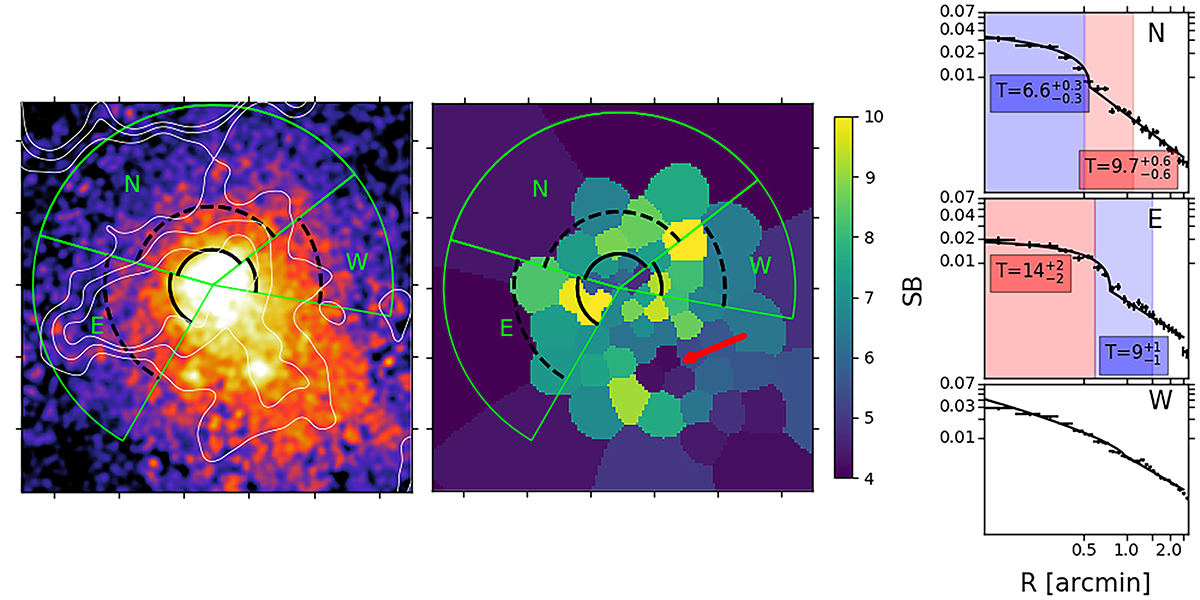
Fig. 2.
Download original image
Surface brightness edges in G113. Left: X-ray image of G113. The green regions represent the three sectors adopted for the extraction of the SB profiles. The solid black lines represent the position of the edge and the boundary of the inner sector where the temperature was measured. The dashed black lines instead represent the boundary of the outer sector where the temperature was measured. Centre: 2D temperature map of G113. The colorbar is in keV units, and the red arrow shows the position of the cold region detected in the cluster. Right (from top to bottom): SB profiles extracted in the northern (N), eastern (E), and western (W) sectors. The continuous black lines represent the best fit of the eastern (χ2/d.o.f. = 0.801 and C = 1.94 ± 0.17), northern (χ2/d.o.f. = 1.56 and C = 1.9 ± 0.2), and western (χ2/d.o.f. = 7.02 and C = 1.14 ± 0.04) jumps. The temperatures reported in the blue and red boxes are in keV units and are the temperatures measured before and after the SB discontinuities. The corresponding blue and red shaded areas show the regions where the temperatures were measured.
Current usage metrics show cumulative count of Article Views (full-text article views including HTML views, PDF and ePub downloads, according to the available data) and Abstracts Views on Vision4Press platform.
Data correspond to usage on the plateform after 2015. The current usage metrics is available 48-96 hours after online publication and is updated daily on week days.
Initial download of the metrics may take a while.