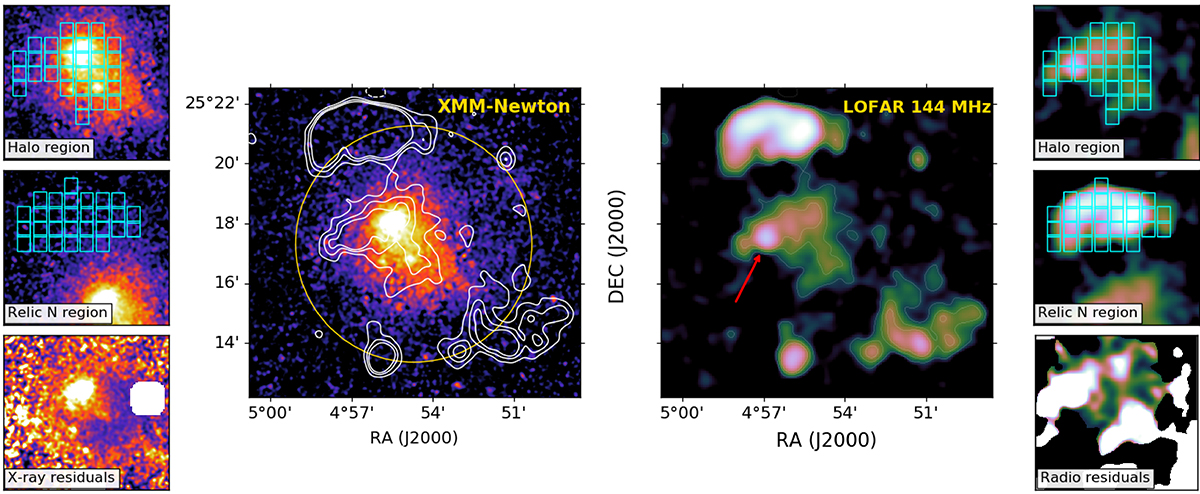
Fig. 1.
Download original image
X-ray and radio emissions of the cluster G113. In particular, central image left: a G113 XMM-Newton observation in the 0.7–1.2 keV band with LOFAR radio contours ([−3, 3, 6, 9, 12] × σ, with σ = 0.37 mJy beam−1) superimposed. The region encircled in gold shows the extension of R500. Central image right: a LOFAR image of G113 with the same contours used for the X-ray image. The resolution of the radio map is 33″ × 27″. The red arrow in the LOFAR panel shows the location of the ambiguous blob radio emission that was not subtracted from the halo emission. Subplots on the left (right) from top to bottom: a close-up of the X-ray (radio) halo region, a close-up of the X-ray (radio) northern relic region, and residuals obtained by dividing the X-ray (radio) image for the best-fit double β-model (exponential model; see Sect. 3.3 for more details).
Current usage metrics show cumulative count of Article Views (full-text article views including HTML views, PDF and ePub downloads, according to the available data) and Abstracts Views on Vision4Press platform.
Data correspond to usage on the plateform after 2015. The current usage metrics is available 48-96 hours after online publication and is updated daily on week days.
Initial download of the metrics may take a while.