Fig. B.1.
Download original image
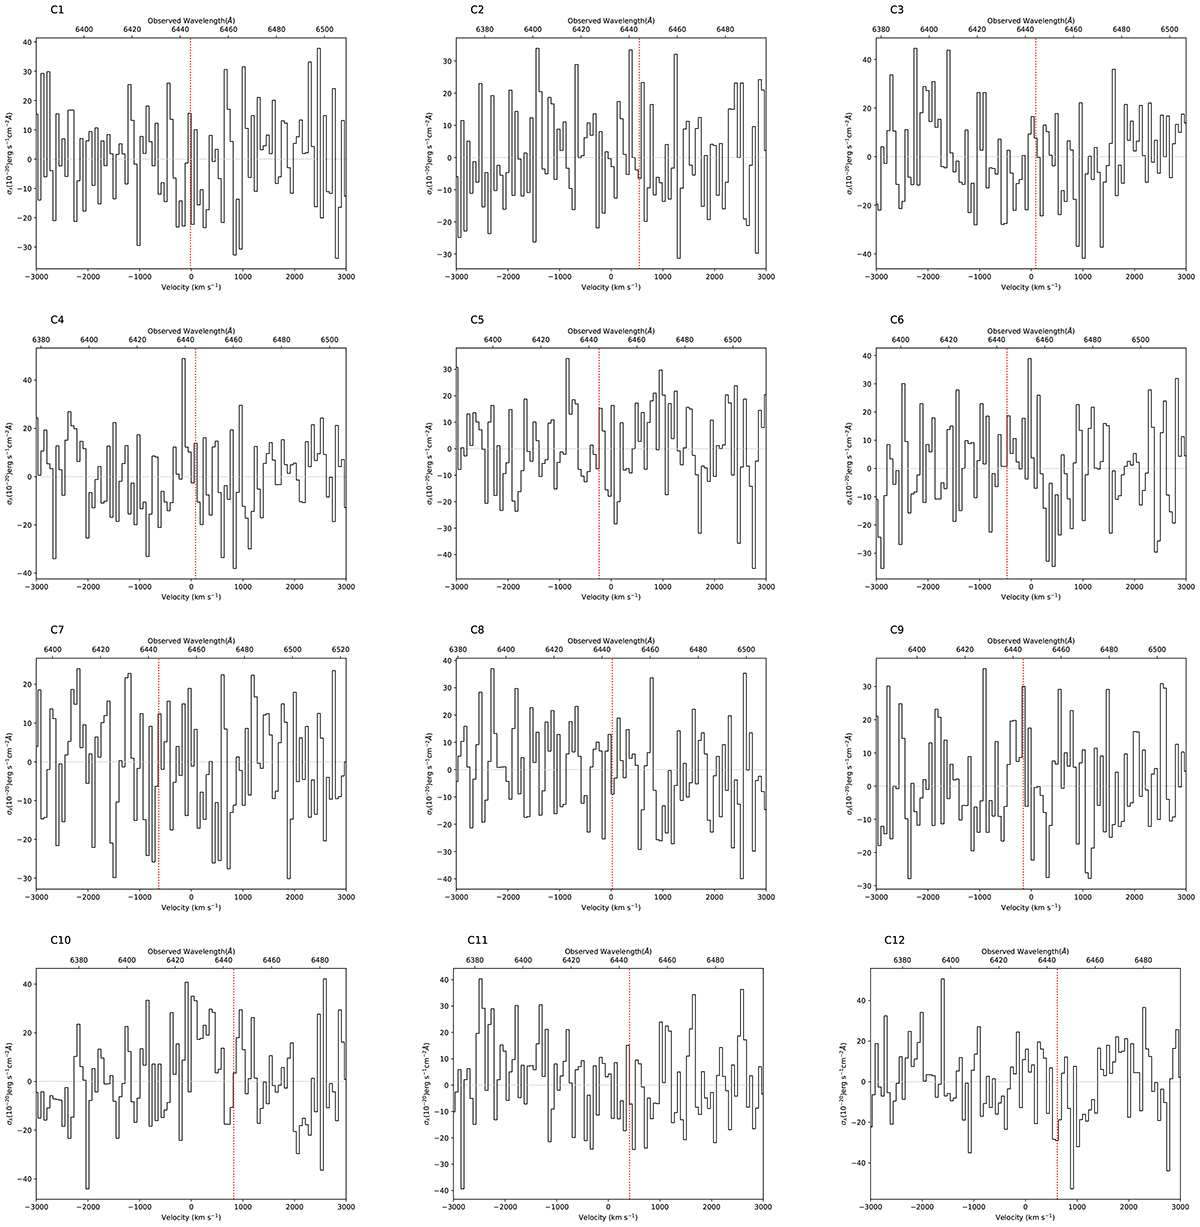
MUSE spectra of all the SMGs previously detected toward the SPT2349-56 system at z = 4.304. The spectra are centered at the expected wavelength for Lyman-α line emission. The red vertical line highlights the location of the Lyman-α emission line expected from the previous [C II]- or CO-based redshift measurement (Miller et al. 2018; Hill et al. 2020). None of the SMGs are formally detected in Lyman-α emission, and only mild evidence for this line is seen in some of these spectra.
Current usage metrics show cumulative count of Article Views (full-text article views including HTML views, PDF and ePub downloads, according to the available data) and Abstracts Views on Vision4Press platform.
Data correspond to usage on the plateform after 2015. The current usage metrics is available 48-96 hours after online publication and is updated daily on week days.
Initial download of the metrics may take a while.