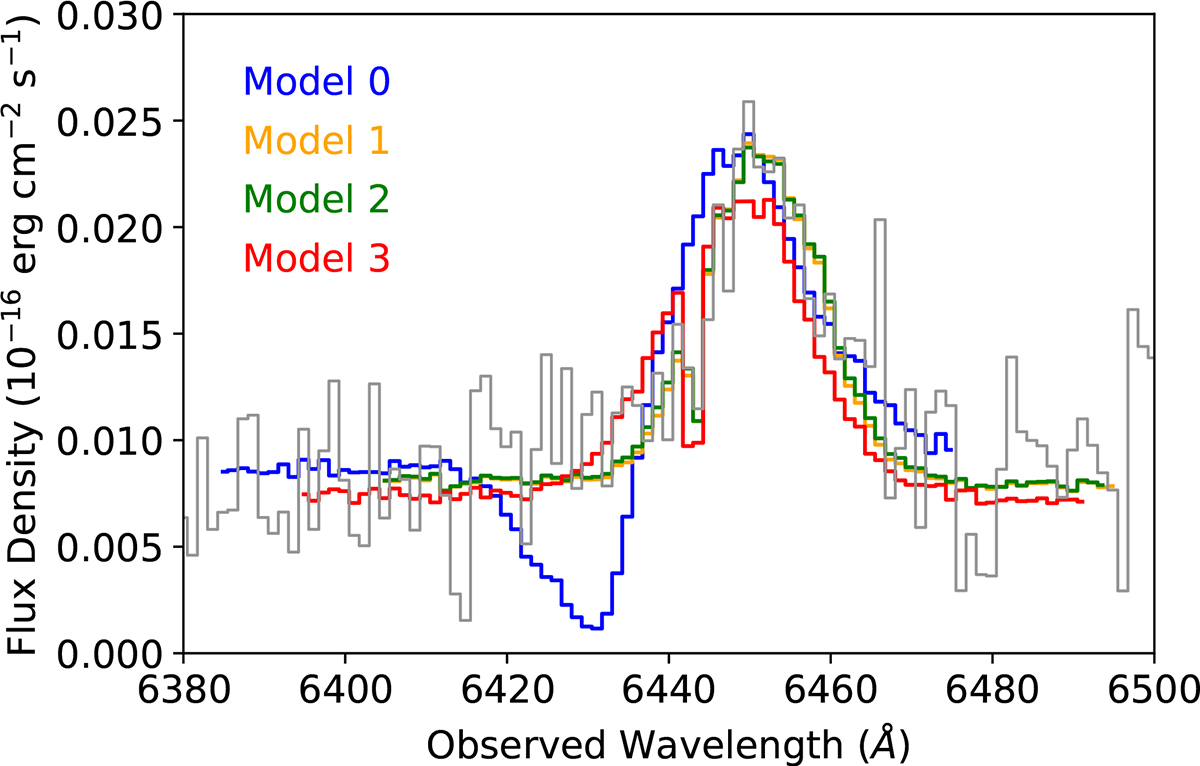
Fig. 7.
Download original image
Lyman-α spectrum of the LAB compared to the best-fit models that assume different systemic redshifts for the emitting source. The models are described in the text and their best-fit parameters are listed in Table 2. The best description of the observed Lyman-α spectrum is given by models 1–3, suggesting that the emission is produced by photoionization either from SMGs C14 or C17, or from the protocluster core.
Current usage metrics show cumulative count of Article Views (full-text article views including HTML views, PDF and ePub downloads, according to the available data) and Abstracts Views on Vision4Press platform.
Data correspond to usage on the plateform after 2015. The current usage metrics is available 48-96 hours after online publication and is updated daily on week days.
Initial download of the metrics may take a while.