Fig. 4.
Download original image
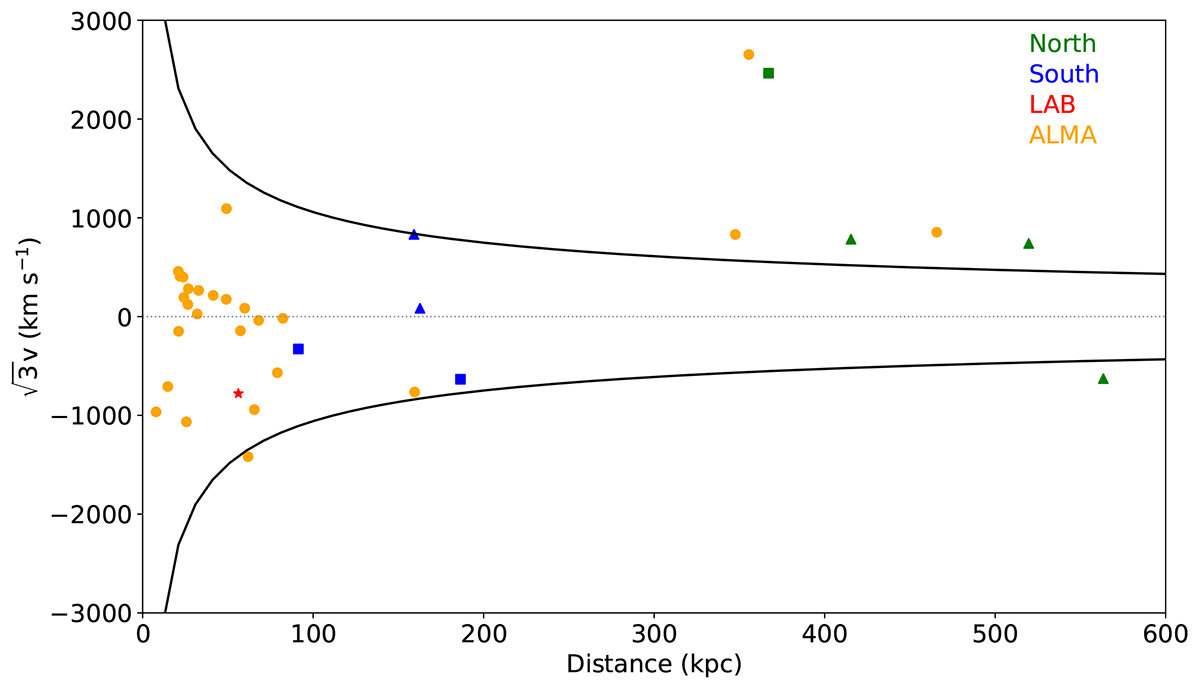
Velocity offset scaled by ![]() – as an estimate for 3D velocity – centered at the center of the protocluster (Hill et al. 2020) versus projected distance from the 850 μm-weighted center of the protocluster. Orange circles show detections of [C II] and CO(4–3) with ALMA (Miller et al. 2018; Hill et al. 2020), green square and triangles show Lyman-α emitters detected and candidates, respectively, in the extended emission showed by LABOCA observations (Fig. 1), blue squares and triangles show the Lyman-α emitters detected and candidates, respectively, in the southern pointing, and the red star shows the Lyman-α blob inside the 90 kpc defined as the effective radius. Black lines show the escape velocity from the protocluster. The measured velocity offset uncertainties are negligible, and therefore error bars are smaller than the size of the symbols.
– as an estimate for 3D velocity – centered at the center of the protocluster (Hill et al. 2020) versus projected distance from the 850 μm-weighted center of the protocluster. Orange circles show detections of [C II] and CO(4–3) with ALMA (Miller et al. 2018; Hill et al. 2020), green square and triangles show Lyman-α emitters detected and candidates, respectively, in the extended emission showed by LABOCA observations (Fig. 1), blue squares and triangles show the Lyman-α emitters detected and candidates, respectively, in the southern pointing, and the red star shows the Lyman-α blob inside the 90 kpc defined as the effective radius. Black lines show the escape velocity from the protocluster. The measured velocity offset uncertainties are negligible, and therefore error bars are smaller than the size of the symbols.
Current usage metrics show cumulative count of Article Views (full-text article views including HTML views, PDF and ePub downloads, according to the available data) and Abstracts Views on Vision4Press platform.
Data correspond to usage on the plateform after 2015. The current usage metrics is available 48-96 hours after online publication and is updated daily on week days.
Initial download of the metrics may take a while.