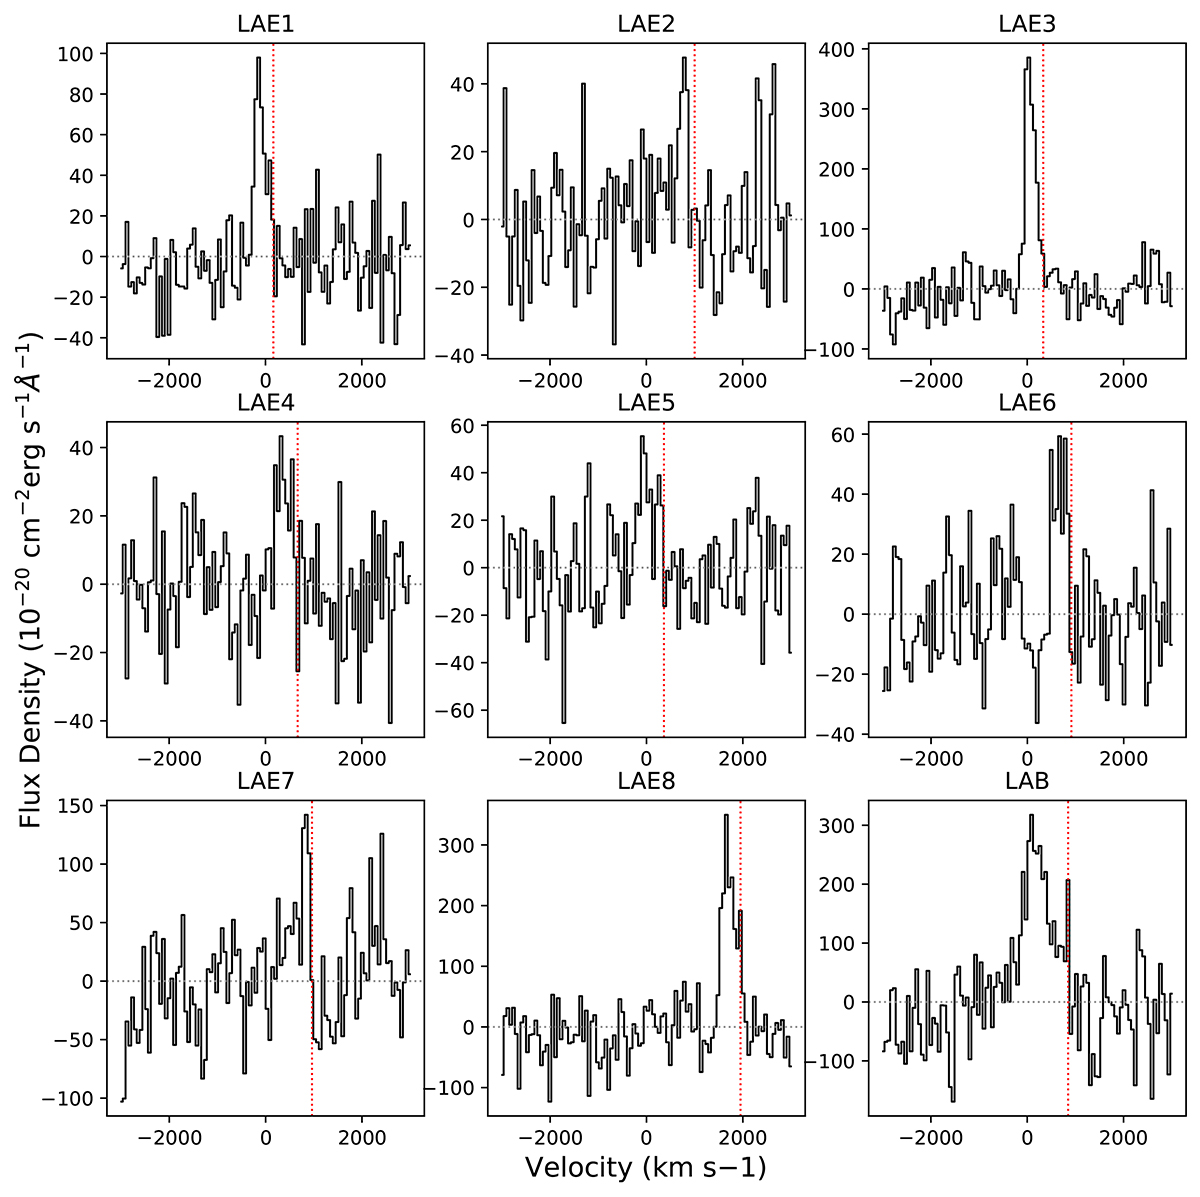
Fig. 3.
Download original image
Continuum-subtracted spectra of the Lyman-α emission line identified significantly within the MUSE footprint around SPT2359-56. The spectra are centered at the central velocity of the protocluster (λ = 6444.2 Å). The measured fluxes are given in Table 1. The red dotted line shows the redshift determined using the prescription from Verhamme et al. (2018). The nomenclature of the LAEs does not follow the signal-to-noise ratio of the emission lines.
Current usage metrics show cumulative count of Article Views (full-text article views including HTML views, PDF and ePub downloads, according to the available data) and Abstracts Views on Vision4Press platform.
Data correspond to usage on the plateform after 2015. The current usage metrics is available 48-96 hours after online publication and is updated daily on week days.
Initial download of the metrics may take a while.