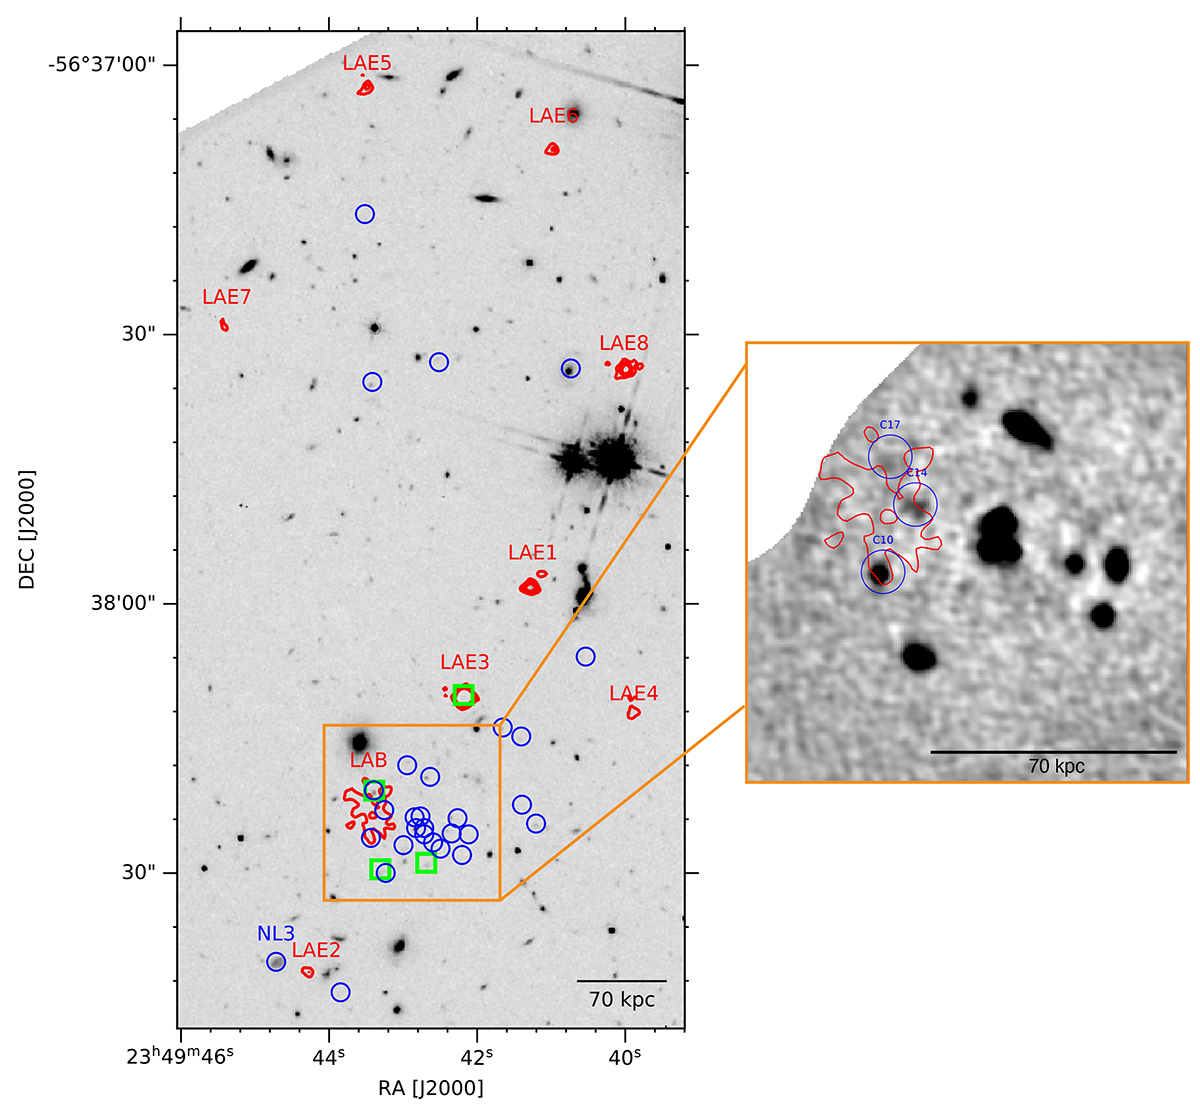
Fig. 2.
Download original image
Lyman-α emission toward the SPT2349-56 protocluster system at z = 4.3. Left: the area covered by MUSE is shown, with the HST F160W image in the background in gray scale, and red contours representing a rendered Lyman-α image. The latter was obtained as the average of each individual line map of the detected LAEs and the LAB, in steps of 2, 5, and 7σ, where σ is the rms noise level in the average image. The blue circles highlight the locations of the ALMA [C II] and CO(4–3) line detections in the field (Miller et al. 2018; Hill et al. 2020). Green squares show the locations of the LBGs in the field (Rotermund et al. 2021). Right: map of ALMA [C II] line emission toward the identified Lyman-α blob (LAB) shown in the background, with blue circles representing the location of the previously identified [C II] line emitters C10, C14, and C17 (see Table 2; Hill et al. 2020). Red contours show the Lyman-α emission of the LAB at 2, 5, and 7σ.
Current usage metrics show cumulative count of Article Views (full-text article views including HTML views, PDF and ePub downloads, according to the available data) and Abstracts Views on Vision4Press platform.
Data correspond to usage on the plateform after 2015. The current usage metrics is available 48-96 hours after online publication and is updated daily on week days.
Initial download of the metrics may take a while.