Fig. 1.
Download original image
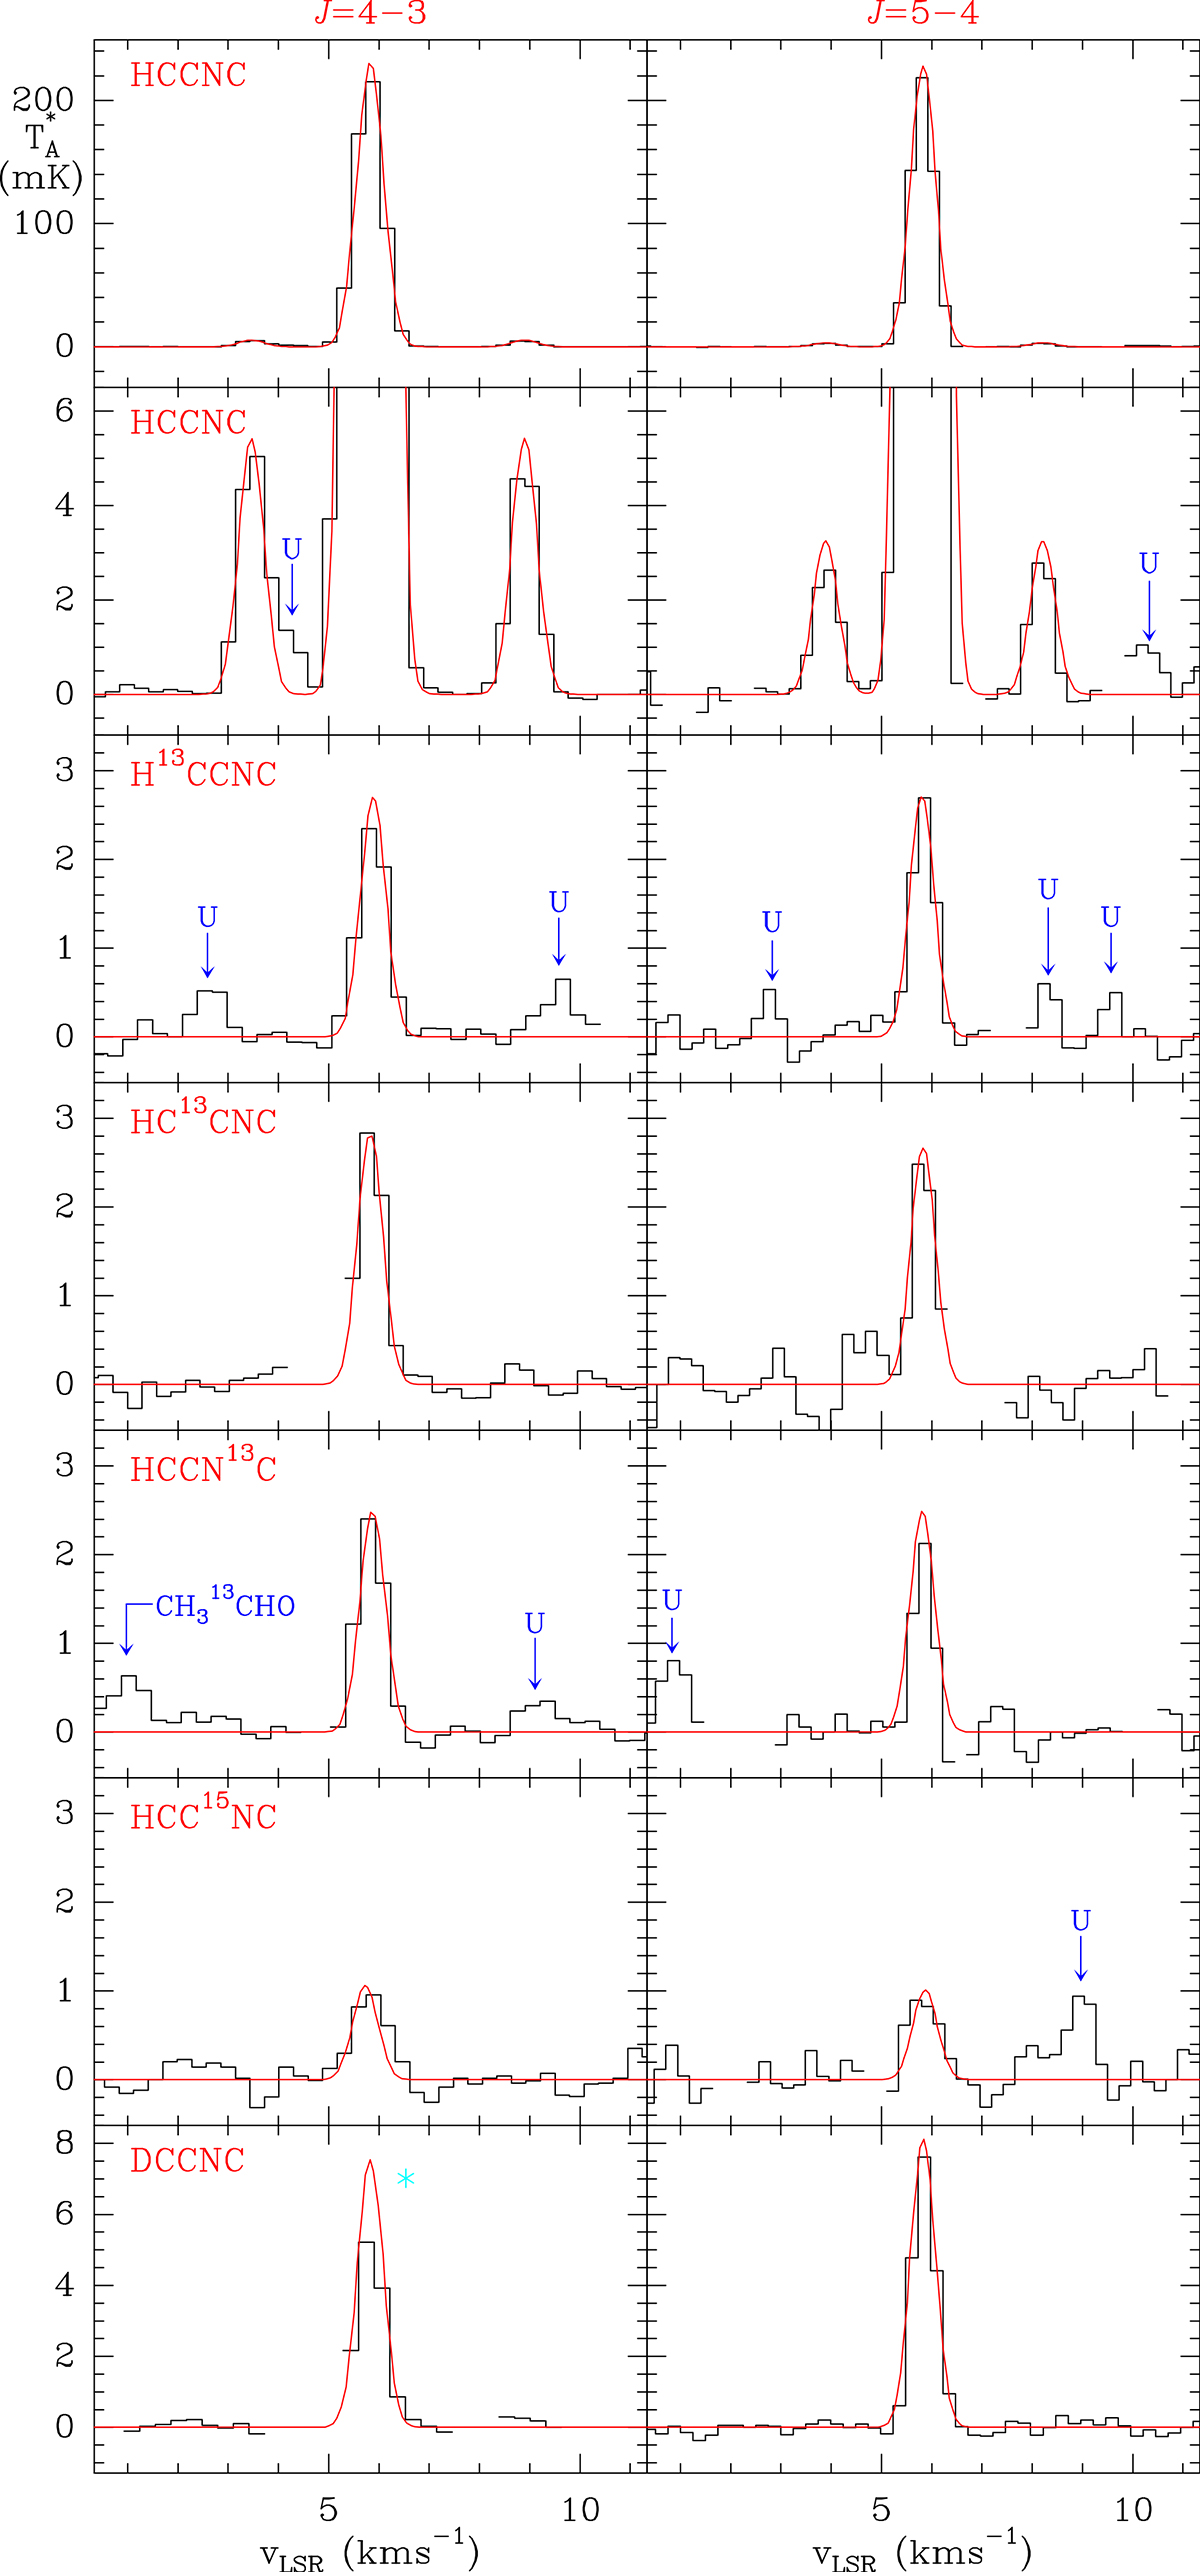
J = 4 − 3 and J = 5 − 4 transitions of the single substituted isotopologs of HCCNC. The abscissa corresponds to the velocity with respect to the local standard of rest. The derived line parameters are given in Table A.1. The ordinate is the antenna temperature, corrected for atmospheric and telescope losses, in mK. Blanked channels correspond to negative features produced when folding the frequency-switched data. The red line shows the computed synthetic spectra for these lines (see Sect. 3.3). The second row panels correspond to a zoom in intensity of the lines of the main isotopolog (first row) to show the emission from its weak hyperfine components. The J = 4 − 3 line of DCCNC (marked with a cyan star) is affected by the negative features produced by the hyperfine structure of CH3CN which is ∼8 MHz above in frequency.
Current usage metrics show cumulative count of Article Views (full-text article views including HTML views, PDF and ePub downloads, according to the available data) and Abstracts Views on Vision4Press platform.
Data correspond to usage on the plateform after 2015. The current usage metrics is available 48-96 hours after online publication and is updated daily on week days.
Initial download of the metrics may take a while.