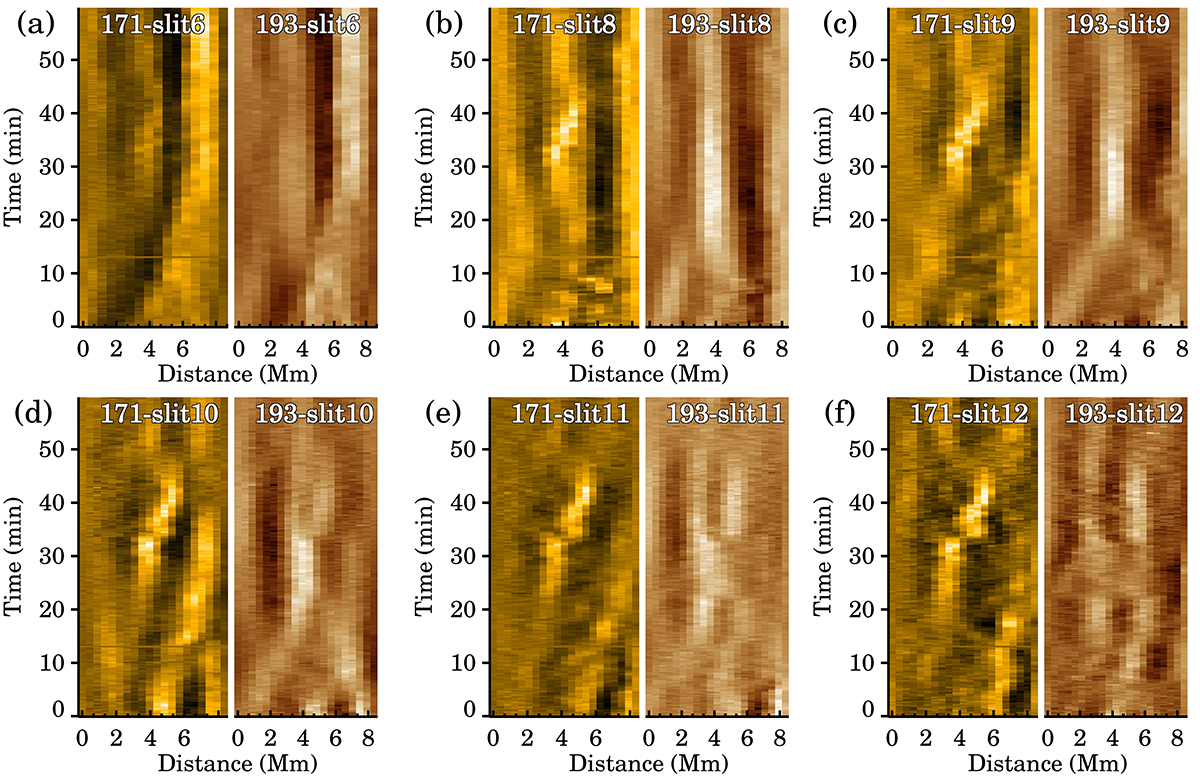
Fig. B.1.
Download original image
Further examples of AIA x-t maps. Each panel contains two maps. The left map shows data from 171 Å, and the right map shows data from 193 Å. The slits we used to create these maps are displayed on top of each panel.
Current usage metrics show cumulative count of Article Views (full-text article views including HTML views, PDF and ePub downloads, according to the available data) and Abstracts Views on Vision4Press platform.
Data correspond to usage on the plateform after 2015. The current usage metrics is available 48-96 hours after online publication and is updated daily on week days.
Initial download of the metrics may take a while.