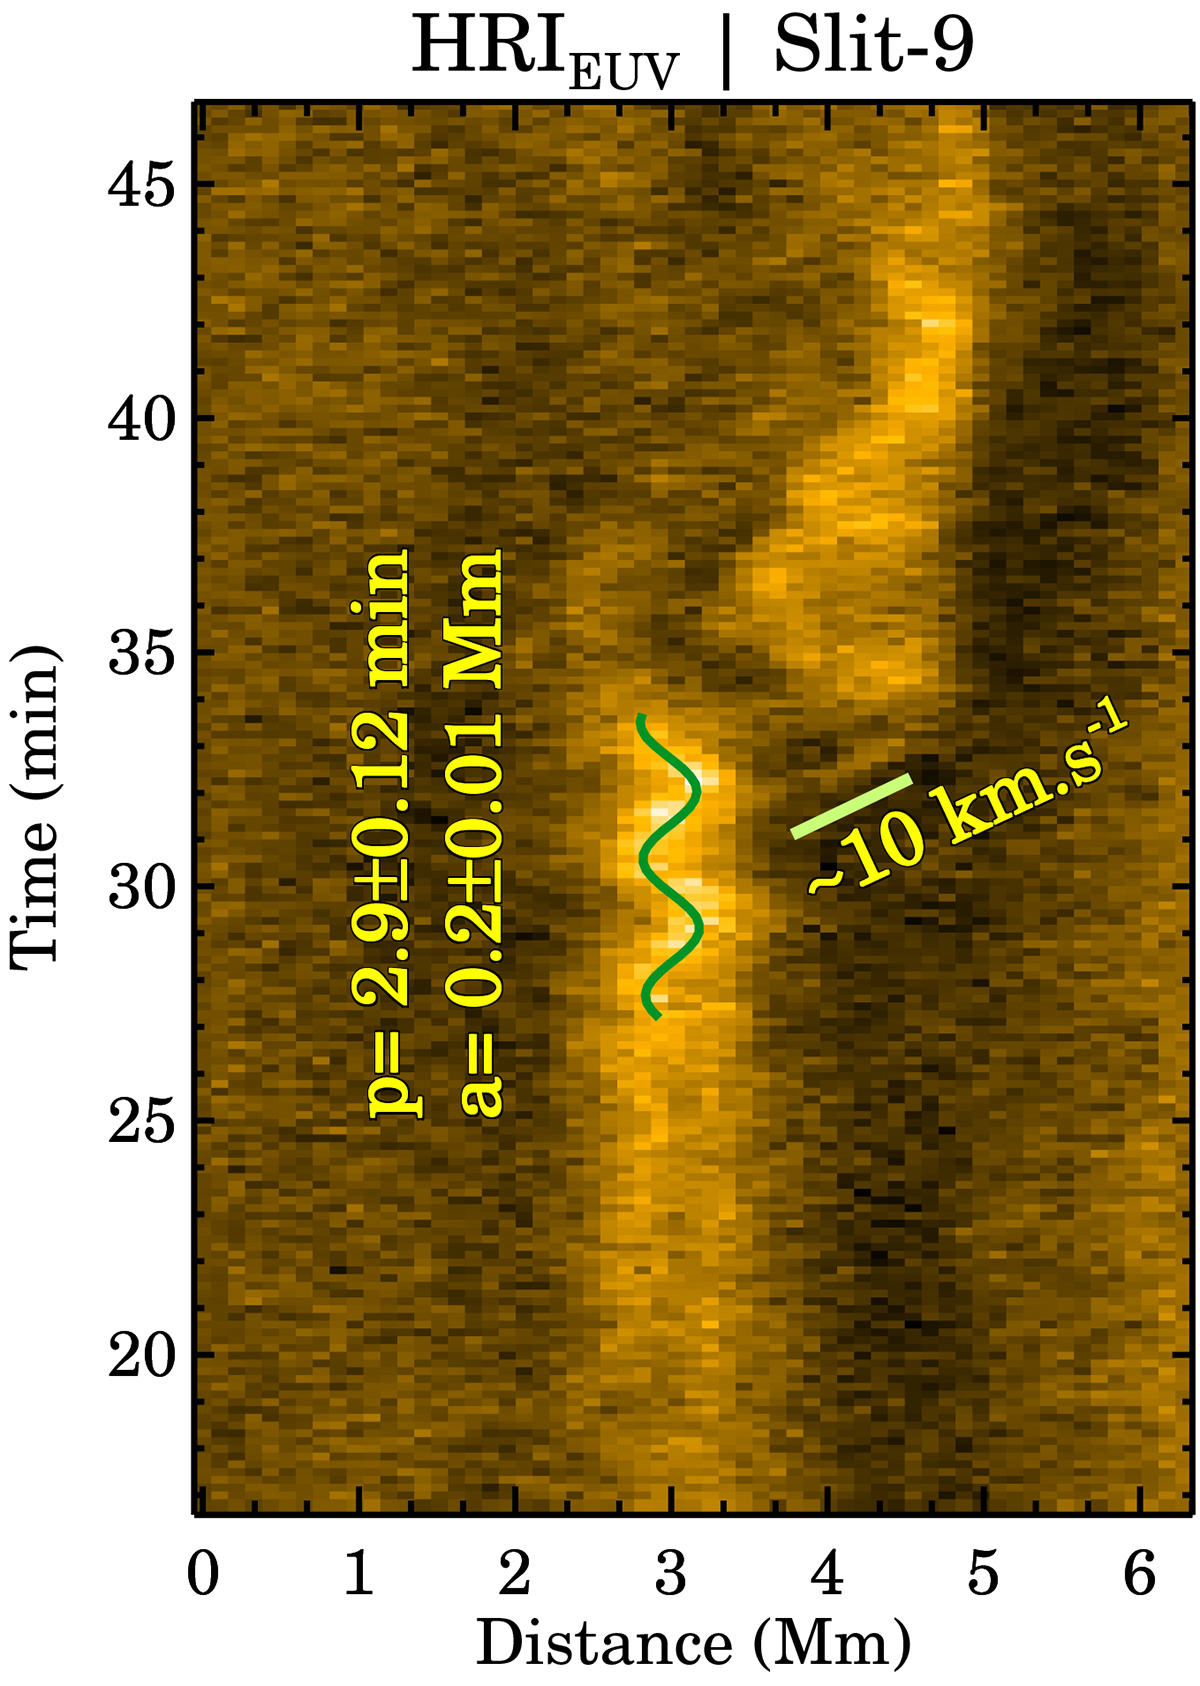
Fig. 7.
Download original image
Oscillations in the HRIEUV x-t map. The green curve outlines the fit to the observed transverse oscillations. The derived parameters are shown in the panel. The green line shows the best fit to the slanted ridge above it. The speed, measured through the slope of the dashed line, is also shown in the panel.
Current usage metrics show cumulative count of Article Views (full-text article views including HTML views, PDF and ePub downloads, according to the available data) and Abstracts Views on Vision4Press platform.
Data correspond to usage on the plateform after 2015. The current usage metrics is available 48-96 hours after online publication and is updated daily on week days.
Initial download of the metrics may take a while.