Fig. 6.
Download original image
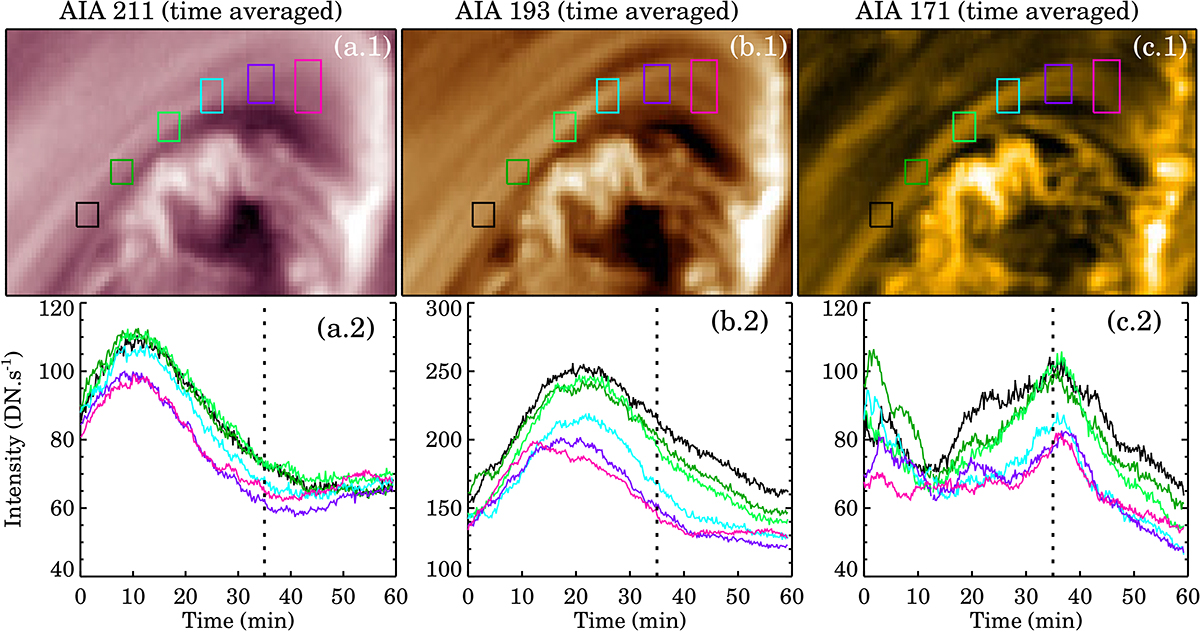
Evolution of the loop intensities in different AIA channels. Panel a.1 shows the time-averaged 211 Å image. The boxes of different colors highlight the locations from which the average intensities (DN s−1) shown in panel a.2 are derived. The same, but for the 193 Å and 171 Å channels, is shown in panels b.1, b.2 and c.1, c.2, respectively. The vertical line in each panel of the bottom row indicates the time stamp at which the loop is first seen to move downward in the 171 Å channel.
Current usage metrics show cumulative count of Article Views (full-text article views including HTML views, PDF and ePub downloads, according to the available data) and Abstracts Views on Vision4Press platform.
Data correspond to usage on the plateform after 2015. The current usage metrics is available 48-96 hours after online publication and is updated daily on week days.
Initial download of the metrics may take a while.