Fig. 4.
Download original image
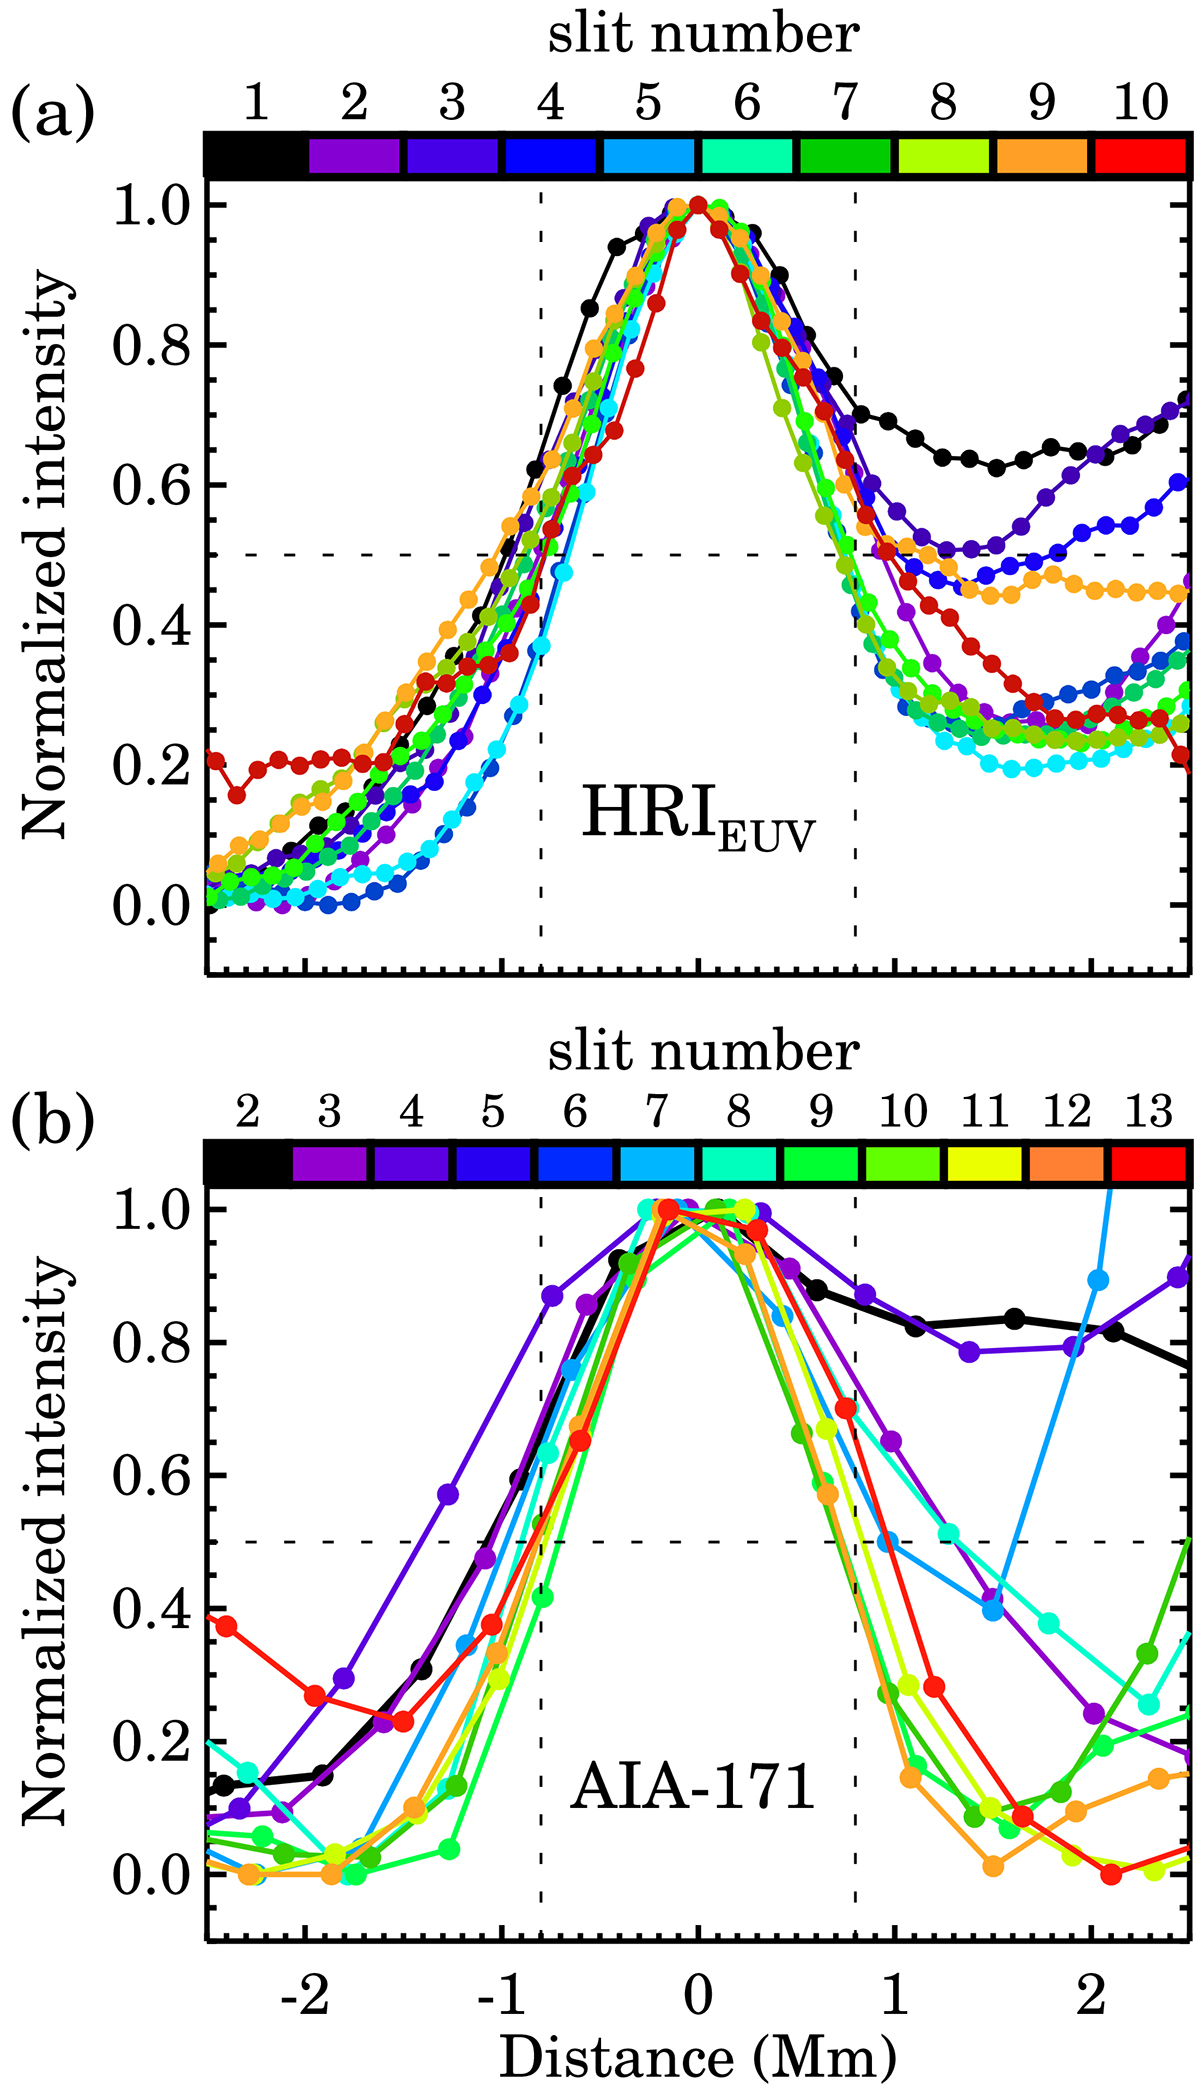
Variation in the loop width along its length. Panel a shows the normalized HRIEUV intensities calculated along different slits (highlighted via the color bar). The same but for the AIA 171 Å data is shown in panel b. The time at which these loop intensities were derived is identical to the time shown in Fig. 1. Each curve is adjusted to ensure that its peak lies at x = 0 Mm. The vertical and horizontal dotted lines in each panel act as references to approximate the FWHM. AIA curves from slits 5 and 6 are not displayed because the nearby moss-type structure contaminates the curves significantly.
Current usage metrics show cumulative count of Article Views (full-text article views including HTML views, PDF and ePub downloads, according to the available data) and Abstracts Views on Vision4Press platform.
Data correspond to usage on the plateform after 2015. The current usage metrics is available 48-96 hours after online publication and is updated daily on week days.
Initial download of the metrics may take a while.