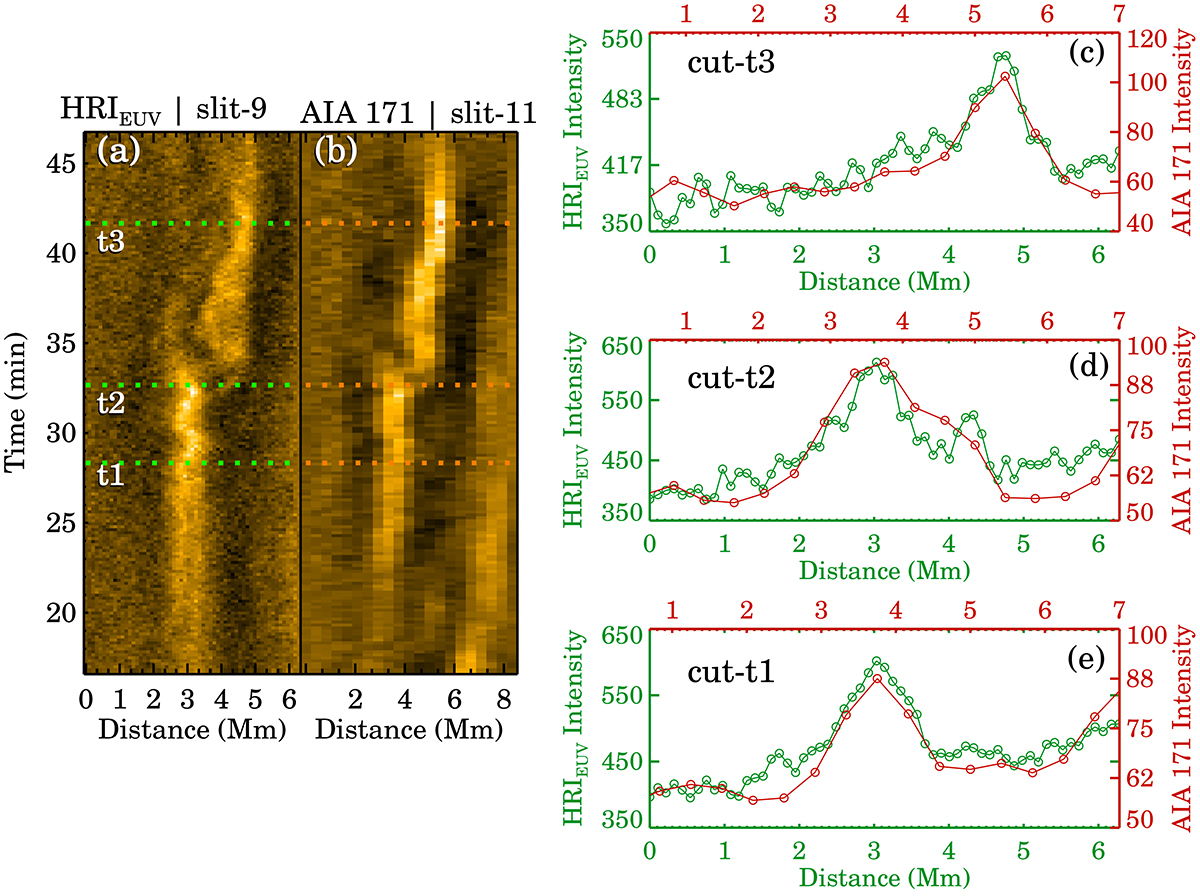
Fig. 3.
Download original image
Comparison of loop widths from HRIEUV and AIA. Panels a and b show x-t maps from HRIEUV and AIA, respectively. The intensity (DN s−1) along the respective colored dashed lines (marked with “t”) is plotted in panels c–e. Panel c shows the derived curves from HRIEUV (green curve) and AIA 171 Å (red) data at t = t3. The curves from t = t2 and t1 are shown in panels d and e, respectively.
Current usage metrics show cumulative count of Article Views (full-text article views including HTML views, PDF and ePub downloads, according to the available data) and Abstracts Views on Vision4Press platform.
Data correspond to usage on the plateform after 2015. The current usage metrics is available 48-96 hours after online publication and is updated daily on week days.
Initial download of the metrics may take a while.