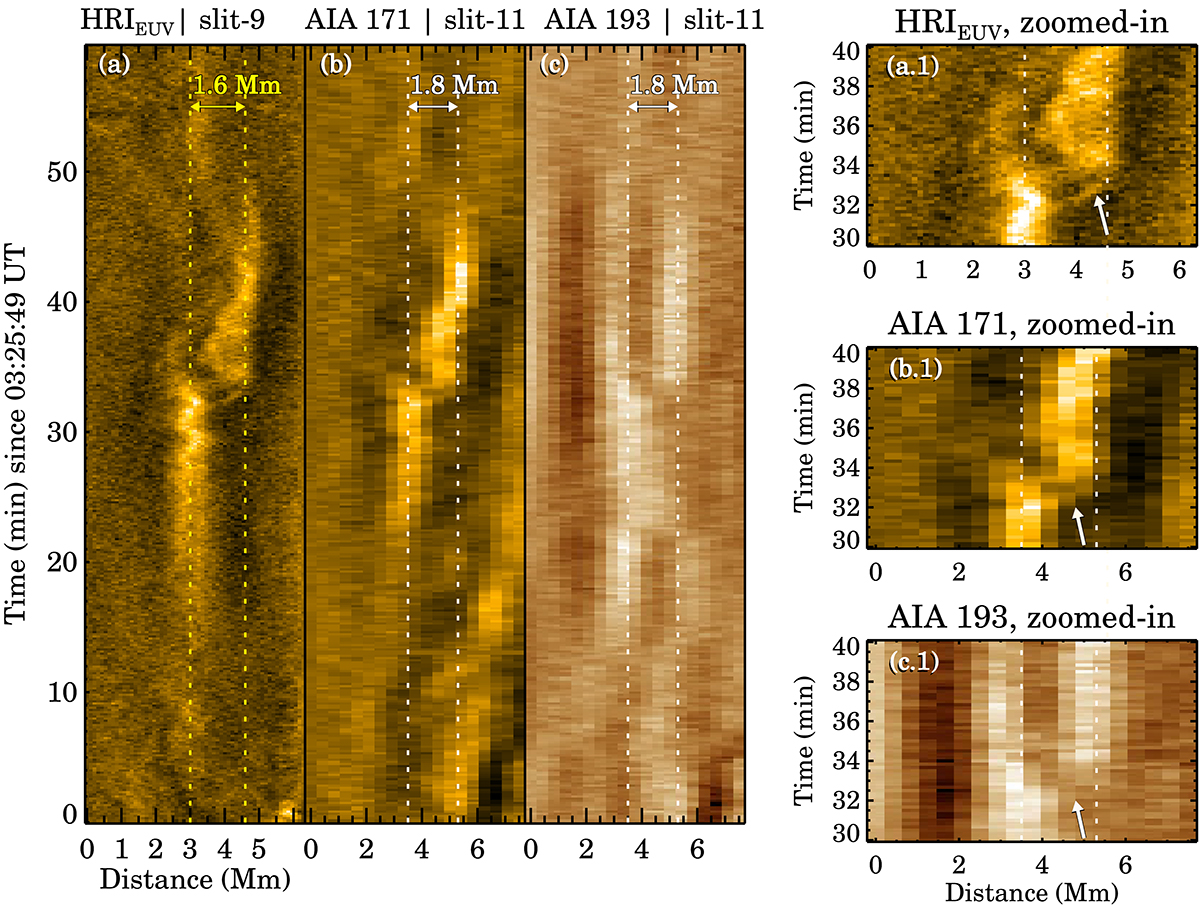
Fig. 2.
Download original image
Representative examples of space-time (x-t) maps derived from the HRIEUV (panel a), AIA 171 Å (panel b), and AIA 193 Å (panel c) image sequences. Zoomed-in versions of these maps, between t = 30 min and 40 min, are presented in panels a.1, b.1, and c.1, respectively. The arrows in these zoomed-in panel point to the slanted ridge that is created by the thin strand. The vertical dotted lines in these panels outline the shift of the loop as judged visually.
Current usage metrics show cumulative count of Article Views (full-text article views including HTML views, PDF and ePub downloads, according to the available data) and Abstracts Views on Vision4Press platform.
Data correspond to usage on the plateform after 2015. The current usage metrics is available 48-96 hours after online publication and is updated daily on week days.
Initial download of the metrics may take a while.