Fig. 1.
Download original image
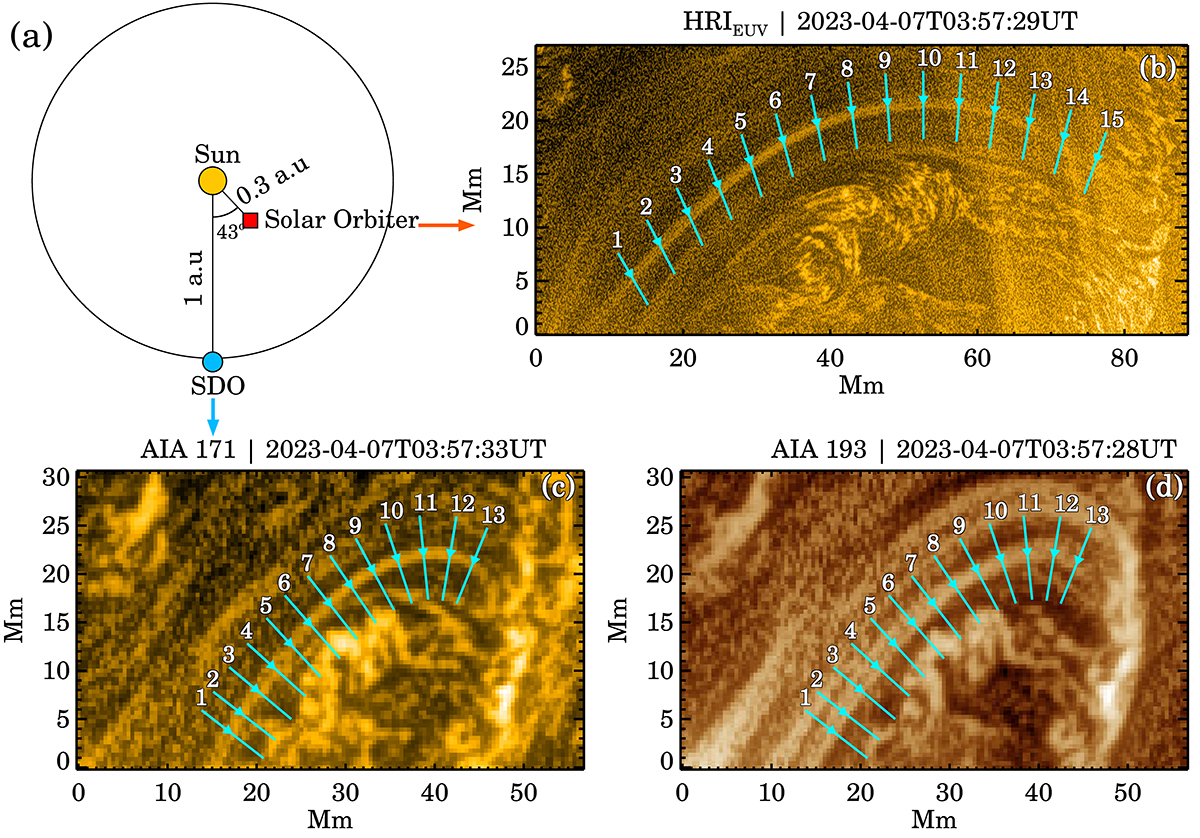
Overview of the event. Panel a depicts the relative position of the two spacecraft, SDO and Solar Orbiter, whose data are used in this study. Panel b shows the loop under study in the HRIEUV image, and panels c and d show the same loop, but as seen in the AIA 171 Å and 193 Å channels, respectively. The cyan lines highlight the locations of the artificial slits that are used to generate space-time maps (shown in Figs. 2, 3, 7 and B.1). The arrow in the center of each slit indicates the direction of increasing distance along the slit. The images in panels b–d are unsharp-masked for an improved visibility of the loop. A movie is available online.
Current usage metrics show cumulative count of Article Views (full-text article views including HTML views, PDF and ePub downloads, according to the available data) and Abstracts Views on Vision4Press platform.
Data correspond to usage on the plateform after 2015. The current usage metrics is available 48-96 hours after online publication and is updated daily on week days.
Initial download of the metrics may take a while.