Fig. 3.
Download original image
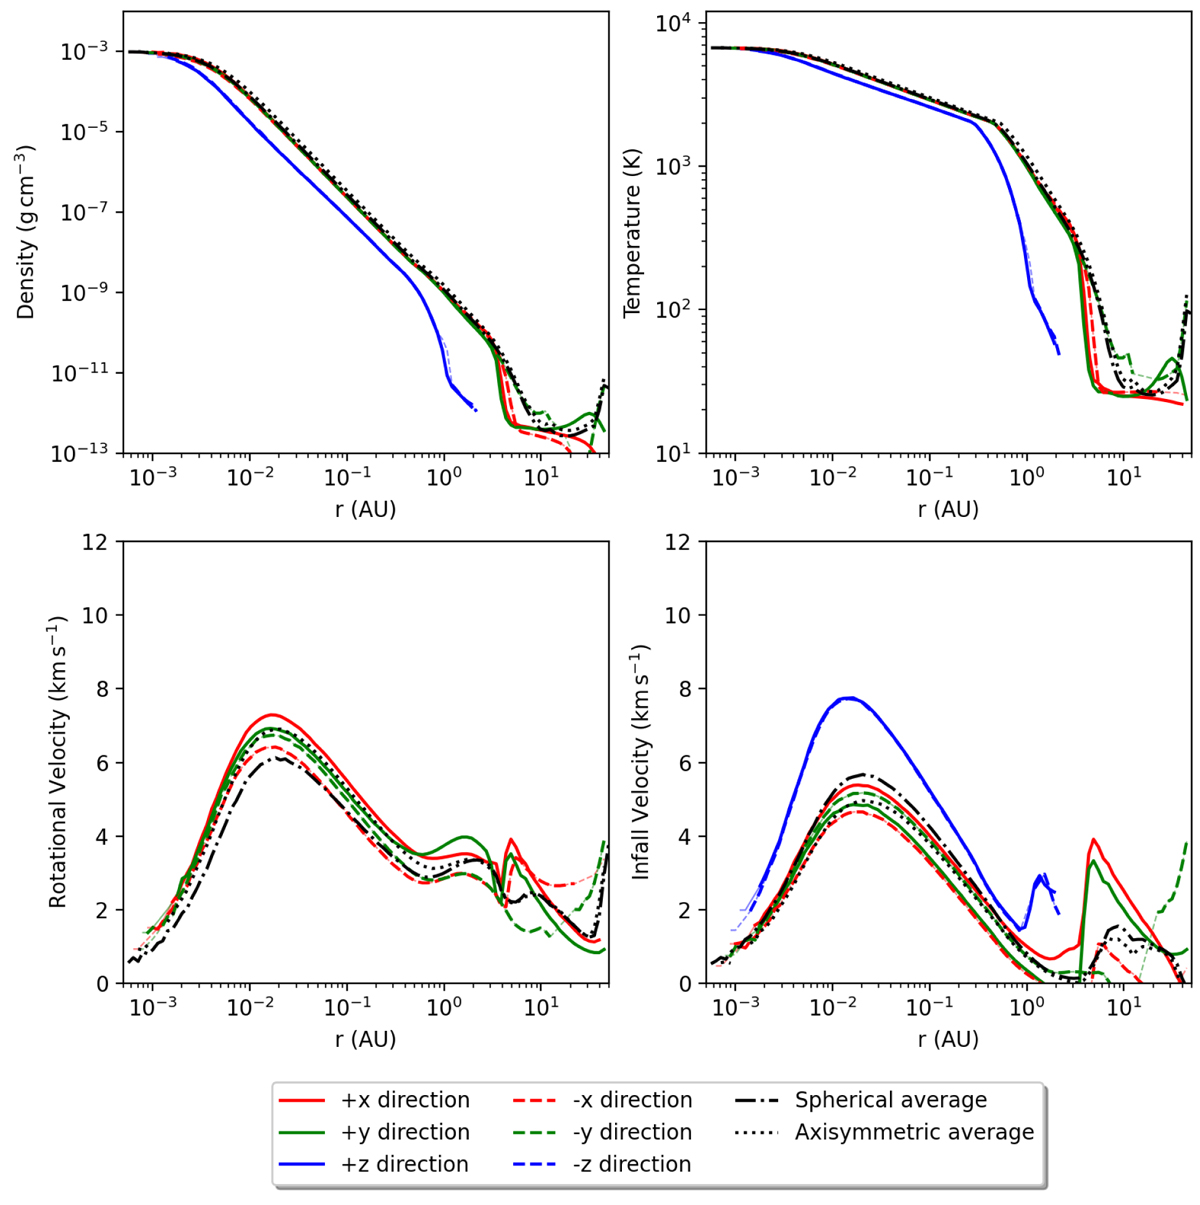
Density, temperature, rotational velocity, and infall velocity at different directions from the centre of one of the protoplanets that form in the benchmark run (see Fig. 2, top) as marked on the graph. The axisymmetric averages are represented by the black dotted lines and the spherical averages are shown by the black dashed line.
Current usage metrics show cumulative count of Article Views (full-text article views including HTML views, PDF and ePub downloads, according to the available data) and Abstracts Views on Vision4Press platform.
Data correspond to usage on the plateform after 2015. The current usage metrics is available 48-96 hours after online publication and is updated daily on week days.
Initial download of the metrics may take a while.