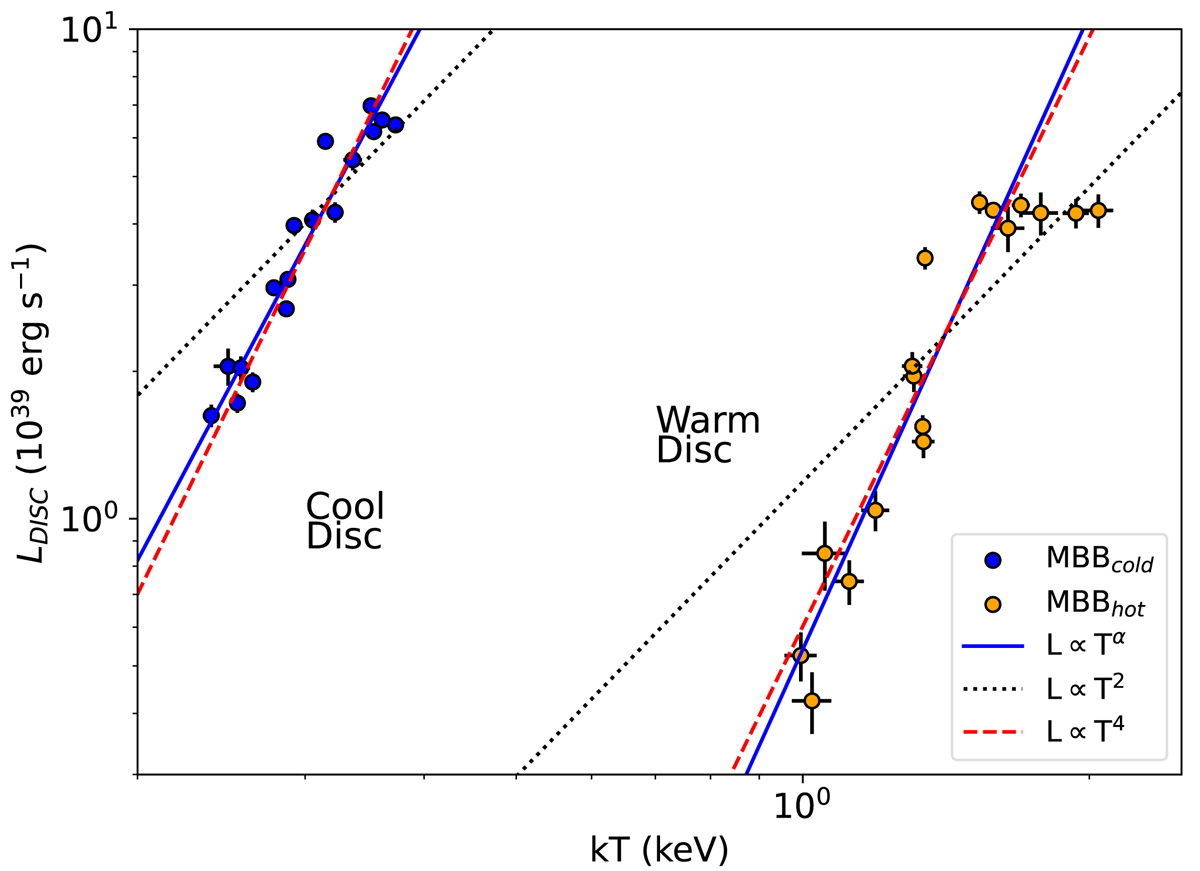
Fig. 10.
Download original image
Luminosity–temperature plot for the RHMM model. Bolometric luminosity (0.001–1000 keV) versus temperature for the cool (in blue) and hot (in orange) components. The black solid, the black-dotted, and the red dashed lines represent the regression line and the two theoretical models of the slim disc and thin disc models, respectively.
Current usage metrics show cumulative count of Article Views (full-text article views including HTML views, PDF and ePub downloads, according to the available data) and Abstracts Views on Vision4Press platform.
Data correspond to usage on the plateform after 2015. The current usage metrics is available 48-96 hours after online publication and is updated daily on week days.
Initial download of the metrics may take a while.