Fig. C.2.
Download original image
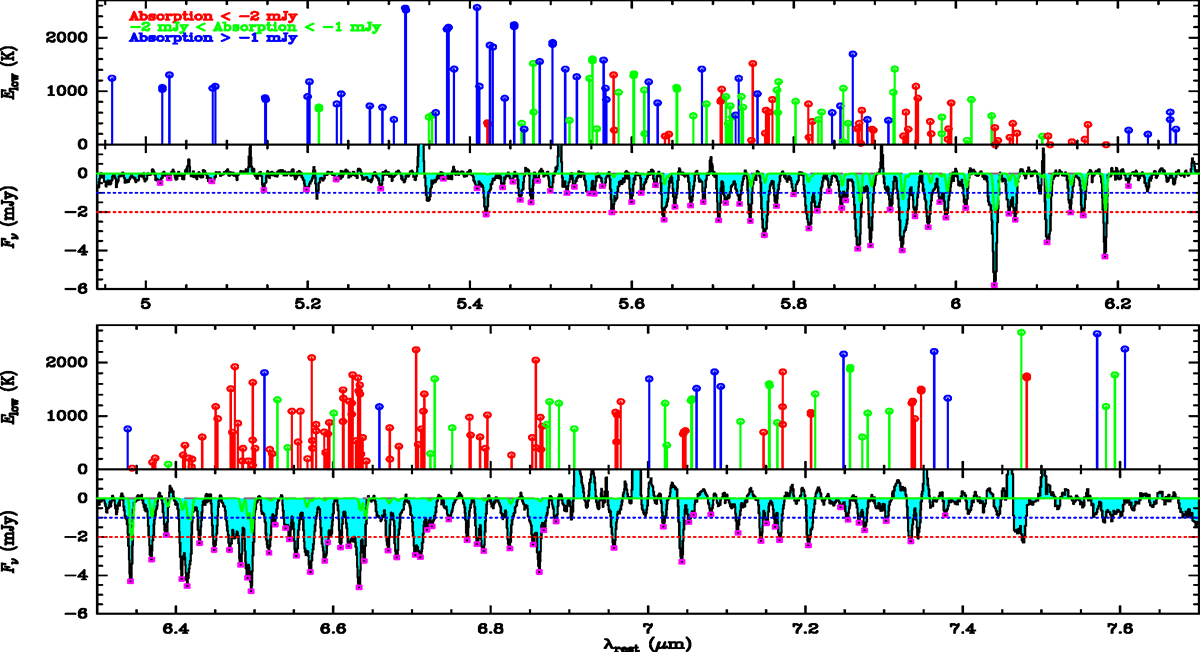
H2O ν2 = 1 − 0 lines that contribute significantly to the features in the 5.0 − 7.7 μm spectrum of VV 114 E SW-s2. In the upper panels, the Elow values are plotted with vertical segments ending in circles, and are colored according to the absorption strength of the spectral feature they belong to relative to the horizontal dotted lines in the lower panels. The magenta squares overplotted on the spectrum indicate the peak flux values for the 116 spectral features that are used to compare the band with model results (Fig. 4c-d).
Current usage metrics show cumulative count of Article Views (full-text article views including HTML views, PDF and ePub downloads, according to the available data) and Abstracts Views on Vision4Press platform.
Data correspond to usage on the plateform after 2015. The current usage metrics is available 48-96 hours after online publication and is updated daily on week days.
Initial download of the metrics may take a while.