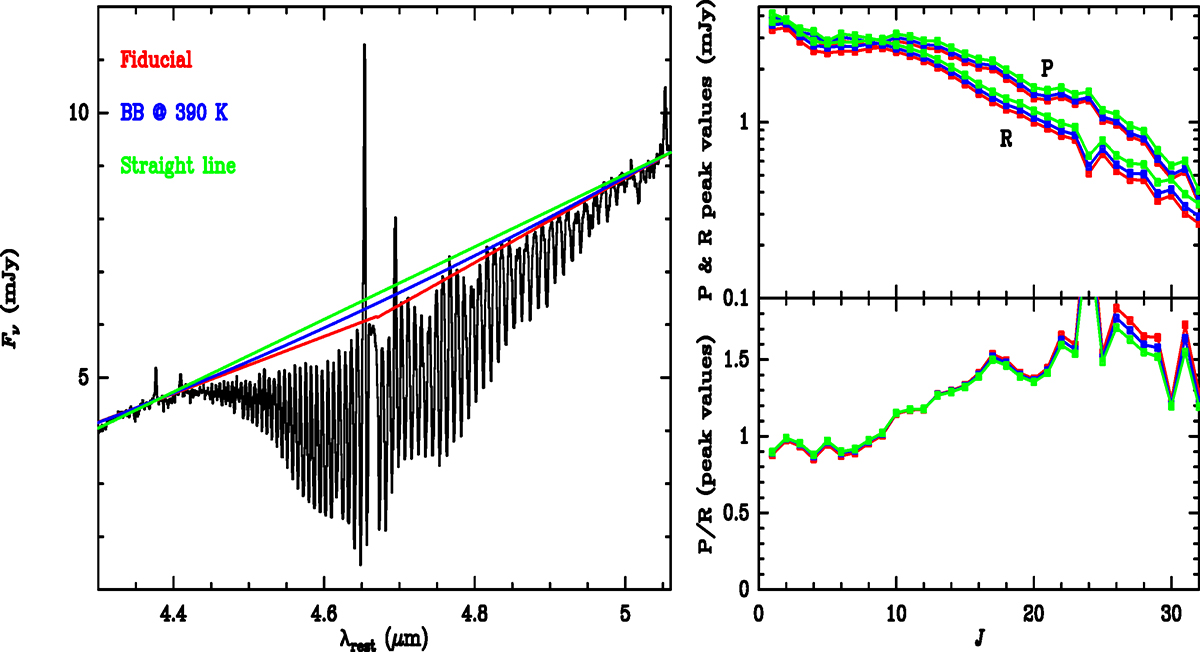
Fig. B.1.
Download original image
Fiducial and alternative baselines for the CO band. Left: Comparison of considered baselines for the CO band. The red curve is the fiducial baseline we have used in this work. Right-upper: Peak absorption values of the CO P(J) and R(J) lines for the three baselines. Right-lower: The CO P-R asymmetry of the peak absorption values for the three baselines.
Current usage metrics show cumulative count of Article Views (full-text article views including HTML views, PDF and ePub downloads, according to the available data) and Abstracts Views on Vision4Press platform.
Data correspond to usage on the plateform after 2015. The current usage metrics is available 48-96 hours after online publication and is updated daily on week days.
Initial download of the metrics may take a while.