Fig. A.1.
Download original image
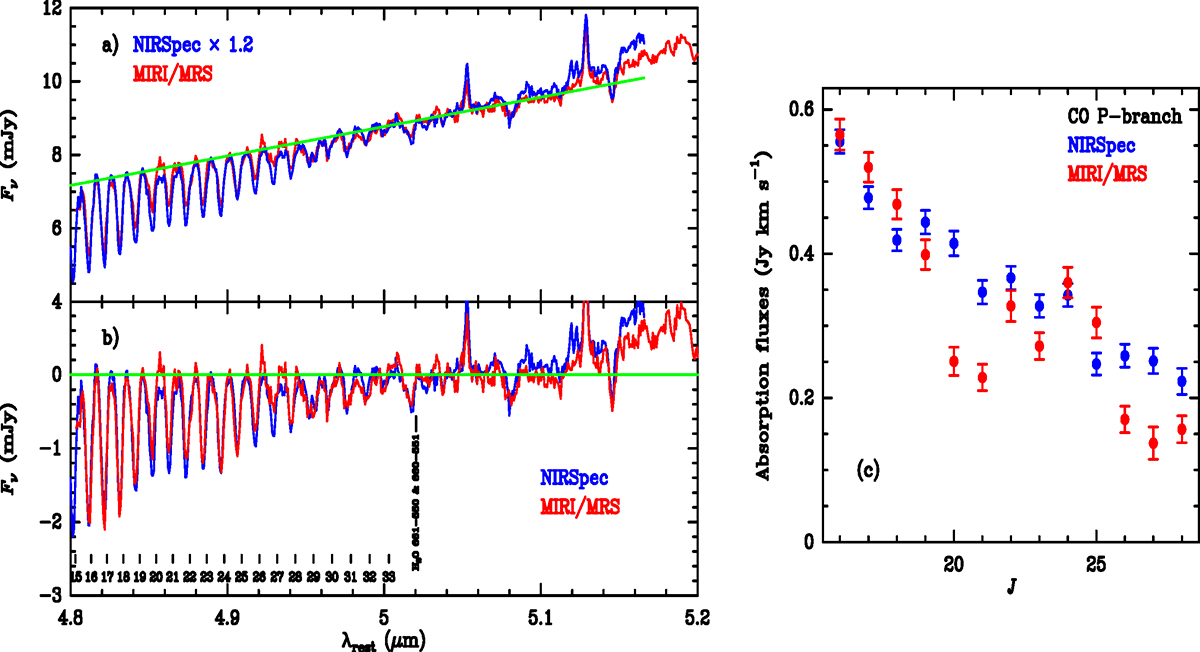
Comparison between NIRSpec and MIRI/MRS spectra and fluxes in the 4.8 − 5.2 μm spectral region. a) NIRSpec G395H and MIRI/MRS CH1-Short spectra of VV114 SW-s2 in the 4.8 − 5.2 μm overlap region. The NIRSpec spectrum has been scaled up by a factor 1.2 to match the MIRI/MRS continuum. The green line is the fiducial baseline used for the CO band. b) Continuum-subtracted spectra, where the NIRSpec spectrum has not been scaled up. c) CO P(16)-P(28) line fluxes from Gaussian fits to the continuum-subtracted spectra of panel b).
Current usage metrics show cumulative count of Article Views (full-text article views including HTML views, PDF and ePub downloads, according to the available data) and Abstracts Views on Vision4Press platform.
Data correspond to usage on the plateform after 2015. The current usage metrics is available 48-96 hours after online publication and is updated daily on week days.
Initial download of the metrics may take a while.