Fig. 4.
Download original image
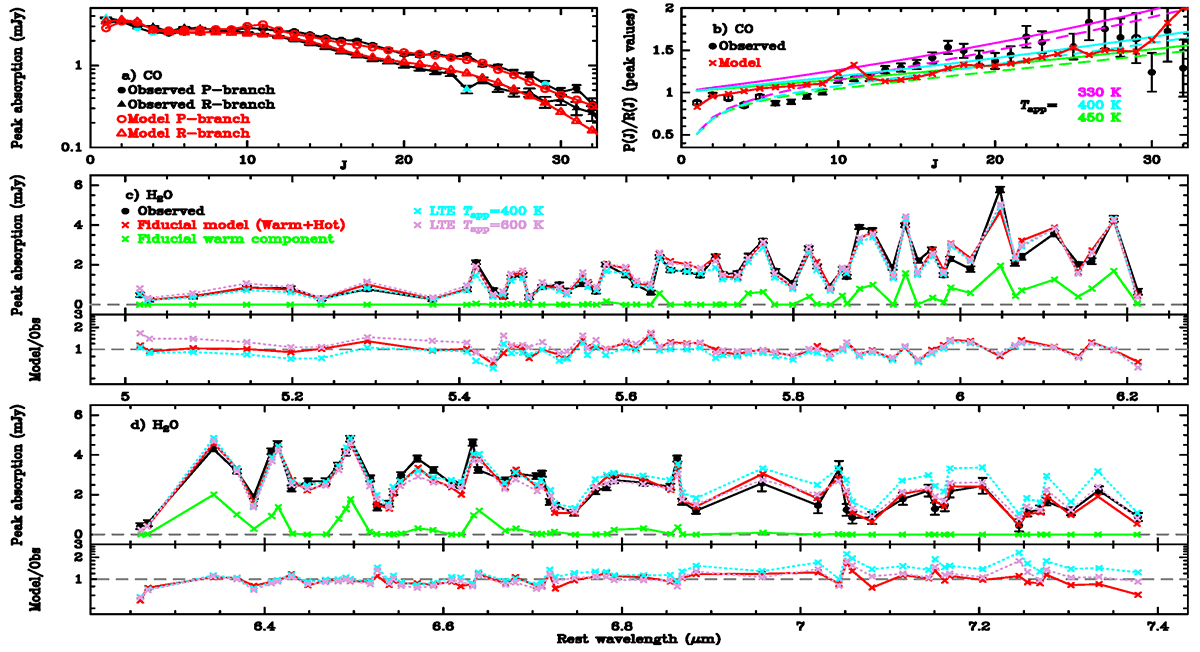
Peak absorption values of ro-vibrational CO lines and H2O spectral features in VV 114 E SW-s2. Panel a: Peak absorption values of the CO P(J) (circles) and R(J) (triangles) lines. Black filled symbols indicate data, and red symbols show the model prediction. Light-blue markers indicate contaminated lines. Panel b: CO P–R asymmetry for the peak absorption values. Black circles indicate data, with opened symbols indicating doubtful ratios due to contaminating lines other than 13CO. Red crosses show model results. The magenta, light-blue, and green curves display the expected trends for several Tapp values in the optically thick (solid) and optically thin (dashed) limits. Panels c,d: Comparison between the H2O peak absorption of 116 spectral features (black circles) and our fiducial model. The contribution by the warm component is shown in green, and the total predicted absorption (warm+hot components) is shown in red. LTE model results with Tapp = 400 and 600 K, Trot = 450 K, and NH2O = 3 × 1019 cm−2 (the same NH2O as in the fiducial model) are also compared with data. The model-to-observed peak absorption ratios are also displayed. Errorbars in this figure do not include uncertainties from continuum subtraction.
Current usage metrics show cumulative count of Article Views (full-text article views including HTML views, PDF and ePub downloads, according to the available data) and Abstracts Views on Vision4Press platform.
Data correspond to usage on the plateform after 2015. The current usage metrics is available 48-96 hours after online publication and is updated daily on week days.
Initial download of the metrics may take a while.