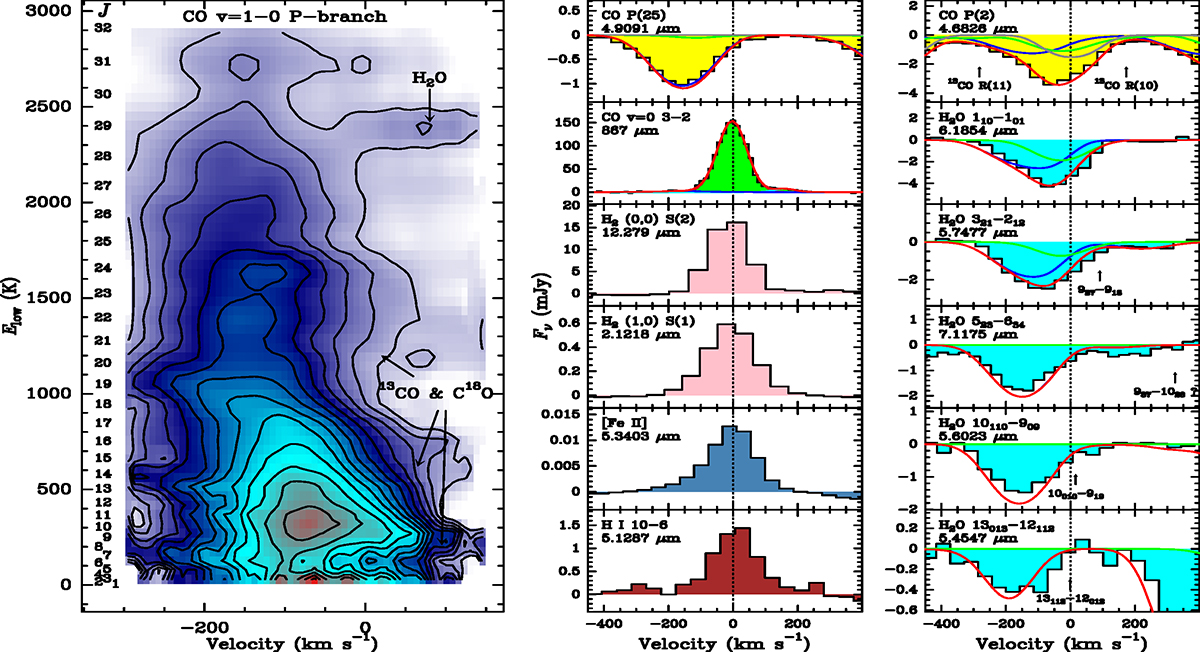
Fig. 3.
Download original image
Velocity field and spectra in VV 114 E SW-s2. Left: Elow-velocity diagram for the CO P branch lines in VV 114 SW-s2. Contamination by adjacent 13CO (together with C18O) and H2O lines is indicated on the red side of the profiles. The numbers on the left side indicate the rotational quantum number J of the lower level. Middle and right: comparison of the profiles of several CO and H2O ro-vibrational lines (in yellow and light-blue, respectively) and the profiles of CO v = 0 J = 3 − 2 line observed with ALMA (green, with a Gaussian fit to the line profile in red), and of several lines of H2 (pink) and hydrogen recombination line (brown). Prediction by our composite models for the ro-vibrational lines is overlaid.
Current usage metrics show cumulative count of Article Views (full-text article views including HTML views, PDF and ePub downloads, according to the available data) and Abstracts Views on Vision4Press platform.
Data correspond to usage on the plateform after 2015. The current usage metrics is available 48-96 hours after online publication and is updated daily on week days.
Initial download of the metrics may take a while.