Fig. 2.
Download original image
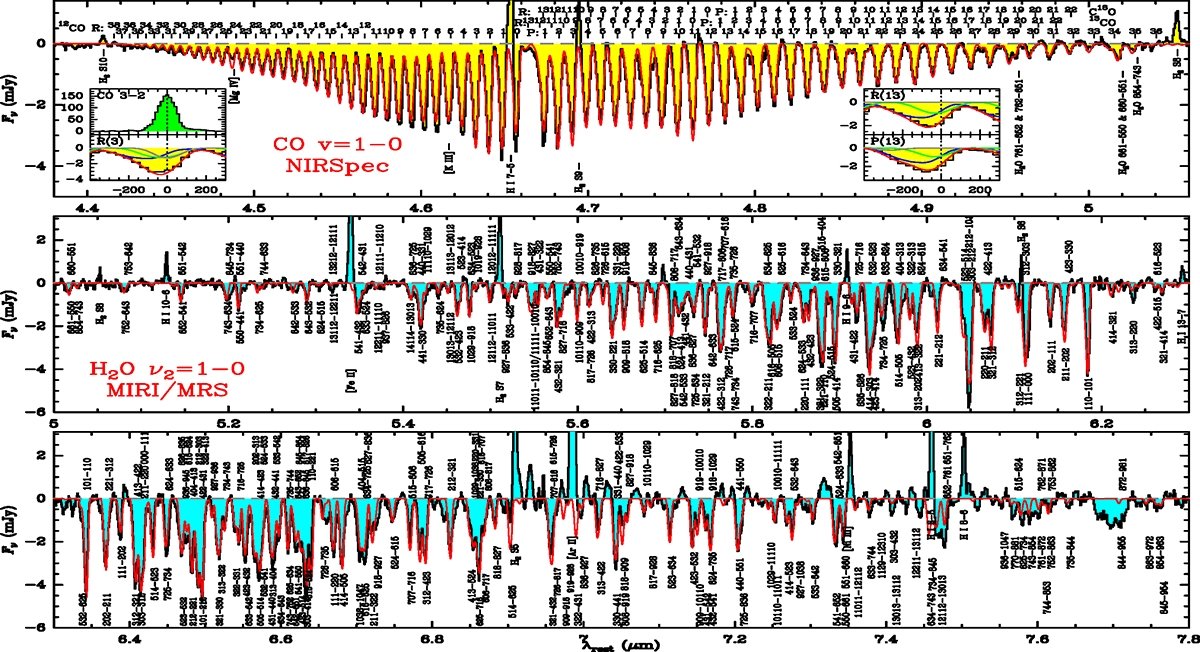
CO v = 1 − 0 (upper panel) and H2O ν2 = 1 − 0 (middle and lower) bands in VV 114 SW-s2. Color-filled black histograms show the data, and the red lines show the total absorption predicted by our composite model. The inserts in the upper panel show the spectra of the CO 3–2 line observed with ALMA and several CO v = 1 − 0 lines with the abscissae in units of velocity; the contributions of each of the three components (blue: hot; green: warm; gray: cold) are also shown. The labels for the H2O ![]() transitions, where the ′ corresponds to the upper vibrational state, are indicated as
transitions, where the ′ corresponds to the upper vibrational state, are indicated as ![]() for readability. Note that all spectral features are blueshifted relative to the labels, because we use CO (3–2) as the velocity reference (z = 0.02013).
for readability. Note that all spectral features are blueshifted relative to the labels, because we use CO (3–2) as the velocity reference (z = 0.02013).
Current usage metrics show cumulative count of Article Views (full-text article views including HTML views, PDF and ePub downloads, according to the available data) and Abstracts Views on Vision4Press platform.
Data correspond to usage on the plateform after 2015. The current usage metrics is available 48-96 hours after online publication and is updated daily on week days.
Initial download of the metrics may take a while.