Fig. D.1.
Download original image
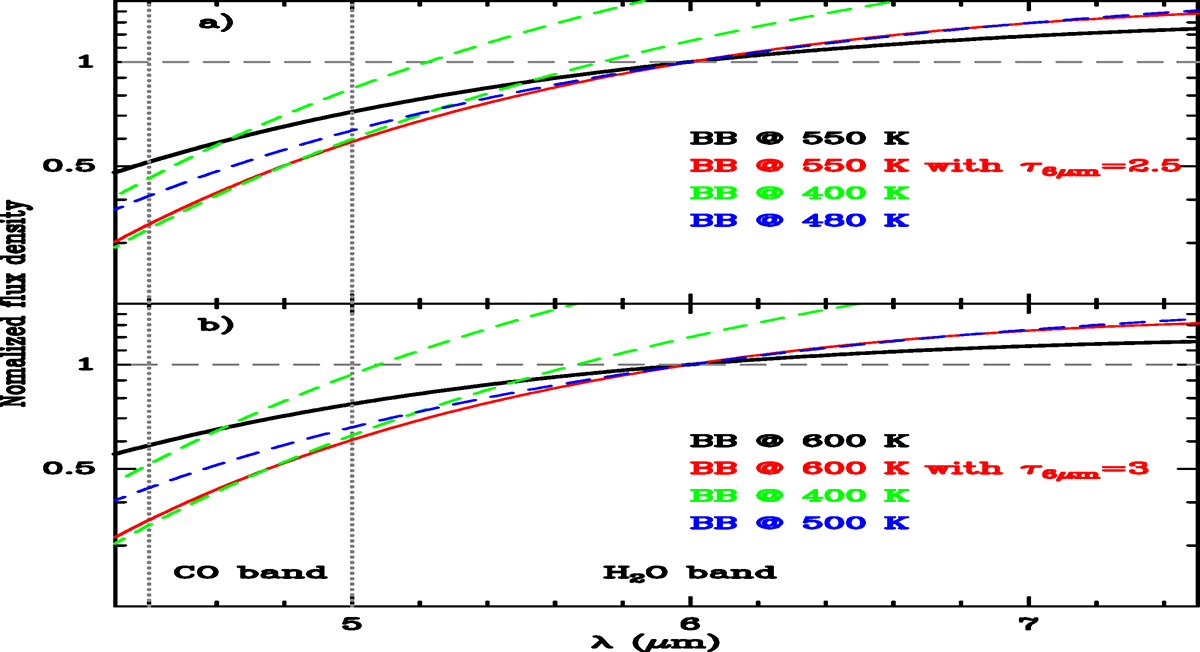
Effect of extinction on the mid-IR continuum slope. The broad black lines show the shape of a blackbody source with a)T = 550 K, and b)T = 600 K. The red curves indicate how the SED changes when the blackbody emission is affected by extinction with ![]() , using the extinction law derived by Indebetouw et al. (2005) and Chiar & Tielens (2006). The dashed green and blue curves are reference blackbodies at 400 and 480 − 500 K.
, using the extinction law derived by Indebetouw et al. (2005) and Chiar & Tielens (2006). The dashed green and blue curves are reference blackbodies at 400 and 480 − 500 K.
Current usage metrics show cumulative count of Article Views (full-text article views including HTML views, PDF and ePub downloads, according to the available data) and Abstracts Views on Vision4Press platform.
Data correspond to usage on the plateform after 2015. The current usage metrics is available 48-96 hours after online publication and is updated daily on week days.
Initial download of the metrics may take a while.