Fig. 1.
Download original image
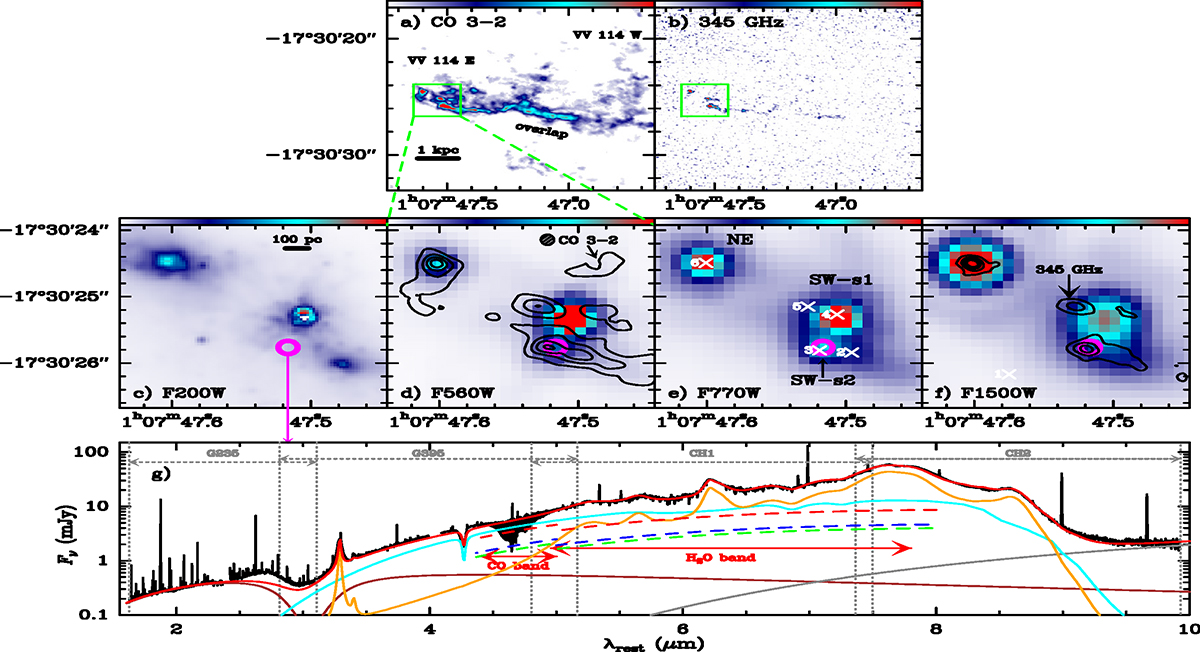
Images of VV 114 and the JWST spectrum of SW-s2. Panels a and b: ALMA maps of CO (3 − 2) (moment 0) and the 345 GHz continuum of the VV 114 system as observed with ALMA. The green box in both panels indicates the nuclear region of VV 114 E mapped in the middle panels. Panels c–f: JWST NIRCam F200W, MIRI F560W, F770W, and F1500 images of the VV 114 E nucleus. Overlaid in panels d and f are the contours of CO (3 − 2) and 345 GHz continuum, respectively. The ALMA beam (0.16″ × 0.14″) is shown in panel d. The 33 GHz continuum sources (Song et al. 2022) are indicated with crosses and labeled in panel e, where we also label the main mid-IR peaks (NE, SW-s1, and SW-s2). The magenta circle, coincident with SW-s2 and 33 GHz source #3, indicates the position where the extreme excitation of CO and H2O is found. Panel g: The near- and mid-IR spectrum extracted from SW-s2. The extent of the CO and H2O bands, and of the NIRSpec gratings and MIRI/MRS channels, are indicated. The solid curves show a model for the continuum, including the PAHs (orange) and three blackbody sources with temperatures 1360 (brown), 550 (light-blue), and 230 K (gray); red is total. The light-blue component, dominating the continuum associated with the molecular bands, is attenuated by foreground material with ![]() (see text). The dashed lines indicate the continuum covered by CO and H2O in the hot (HC, in blue), the warm (WC, in green), and the sum of both (in red), as predicted by the fiducial model for the bands.
(see text). The dashed lines indicate the continuum covered by CO and H2O in the hot (HC, in blue), the warm (WC, in green), and the sum of both (in red), as predicted by the fiducial model for the bands.
Current usage metrics show cumulative count of Article Views (full-text article views including HTML views, PDF and ePub downloads, according to the available data) and Abstracts Views on Vision4Press platform.
Data correspond to usage on the plateform after 2015. The current usage metrics is available 48-96 hours after online publication and is updated daily on week days.
Initial download of the metrics may take a while.