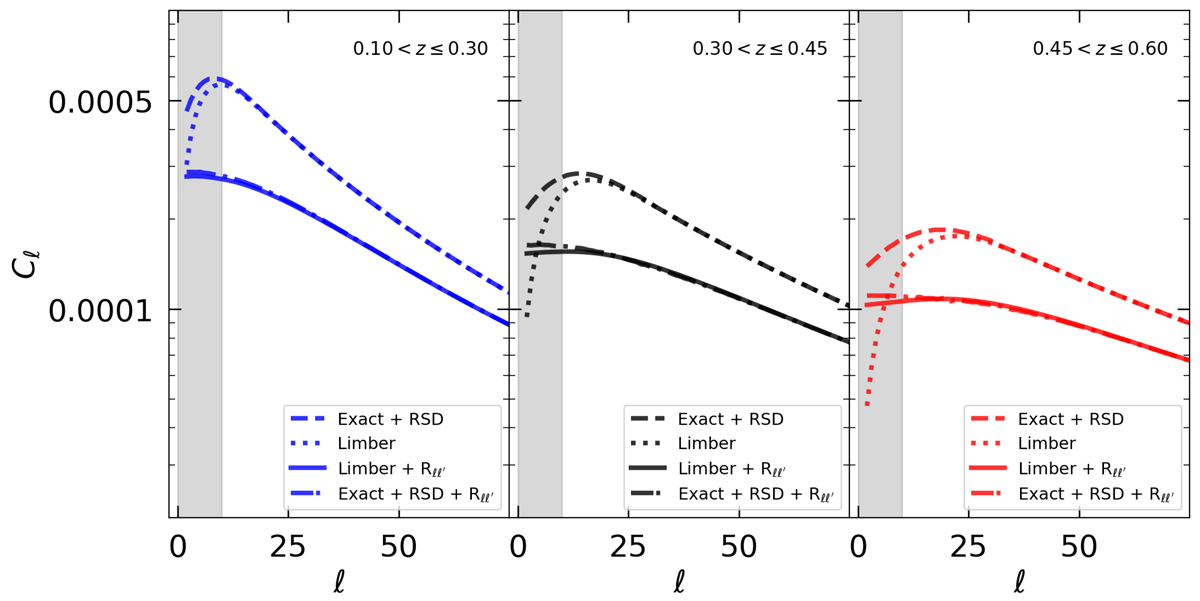
Fig. 7.
Download original image
Theoretical angular power spectrum for our three redshift bins. The Limber approximation is represented with a dotted line, while the exact computation is presented in Eqs. (31) and (32) with a dashed line. The convolution with the mixing matrix is shown, respectively, with a solid line (Limber approximation, i.e. the model used in our analysis), and with a dot-dashed line (exact computation). After the mode-mode coupling, the Limber approximation deviates only for ℓ ≲ 10, i.e. for the angular range already excluded from our analysis (gray shaded region).
Current usage metrics show cumulative count of Article Views (full-text article views including HTML views, PDF and ePub downloads, according to the available data) and Abstracts Views on Vision4Press platform.
Data correspond to usage on the plateform after 2015. The current usage metrics is available 48-96 hours after online publication and is updated daily on week days.
Initial download of the metrics may take a while.