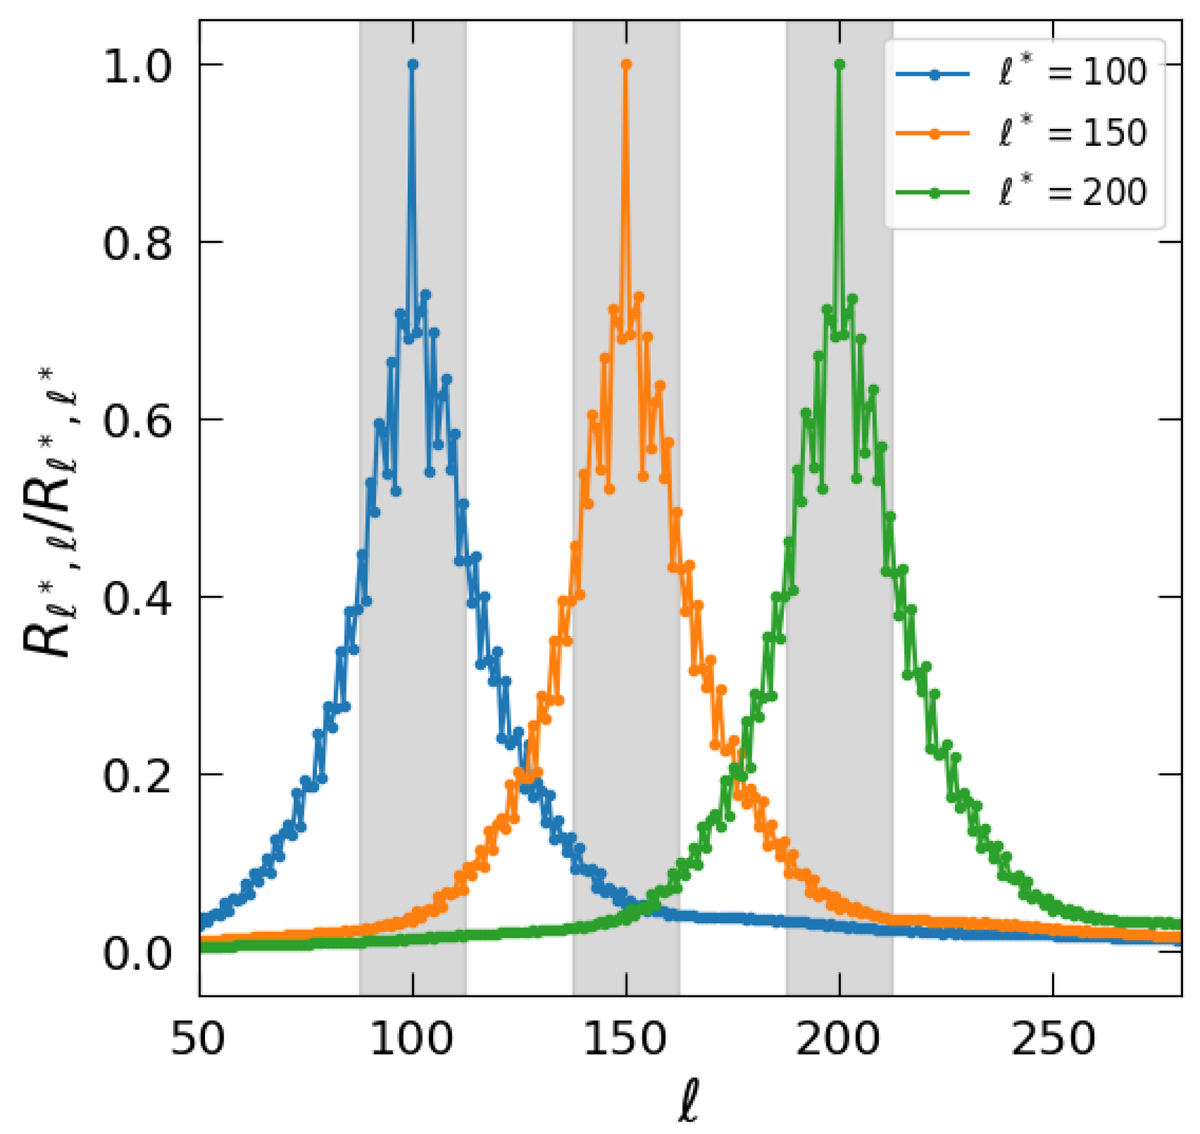
Fig. 5.
Download original image
Normalised elements of the mixing matrix Rℓℓ′, centred in three different multipoles ℓ* = 100, 150, 200. The functions decrease as we move away from ℓ*. Their value give us a quantitative amount of the correlation between different multipoles, induced by the mask. The gray shaded regions indicate the bin width Δℓ = 25 of our analysis.
Current usage metrics show cumulative count of Article Views (full-text article views including HTML views, PDF and ePub downloads, according to the available data) and Abstracts Views on Vision4Press platform.
Data correspond to usage on the plateform after 2015. The current usage metrics is available 48-96 hours after online publication and is updated daily on week days.
Initial download of the metrics may take a while.