Fig. 3.
Download original image
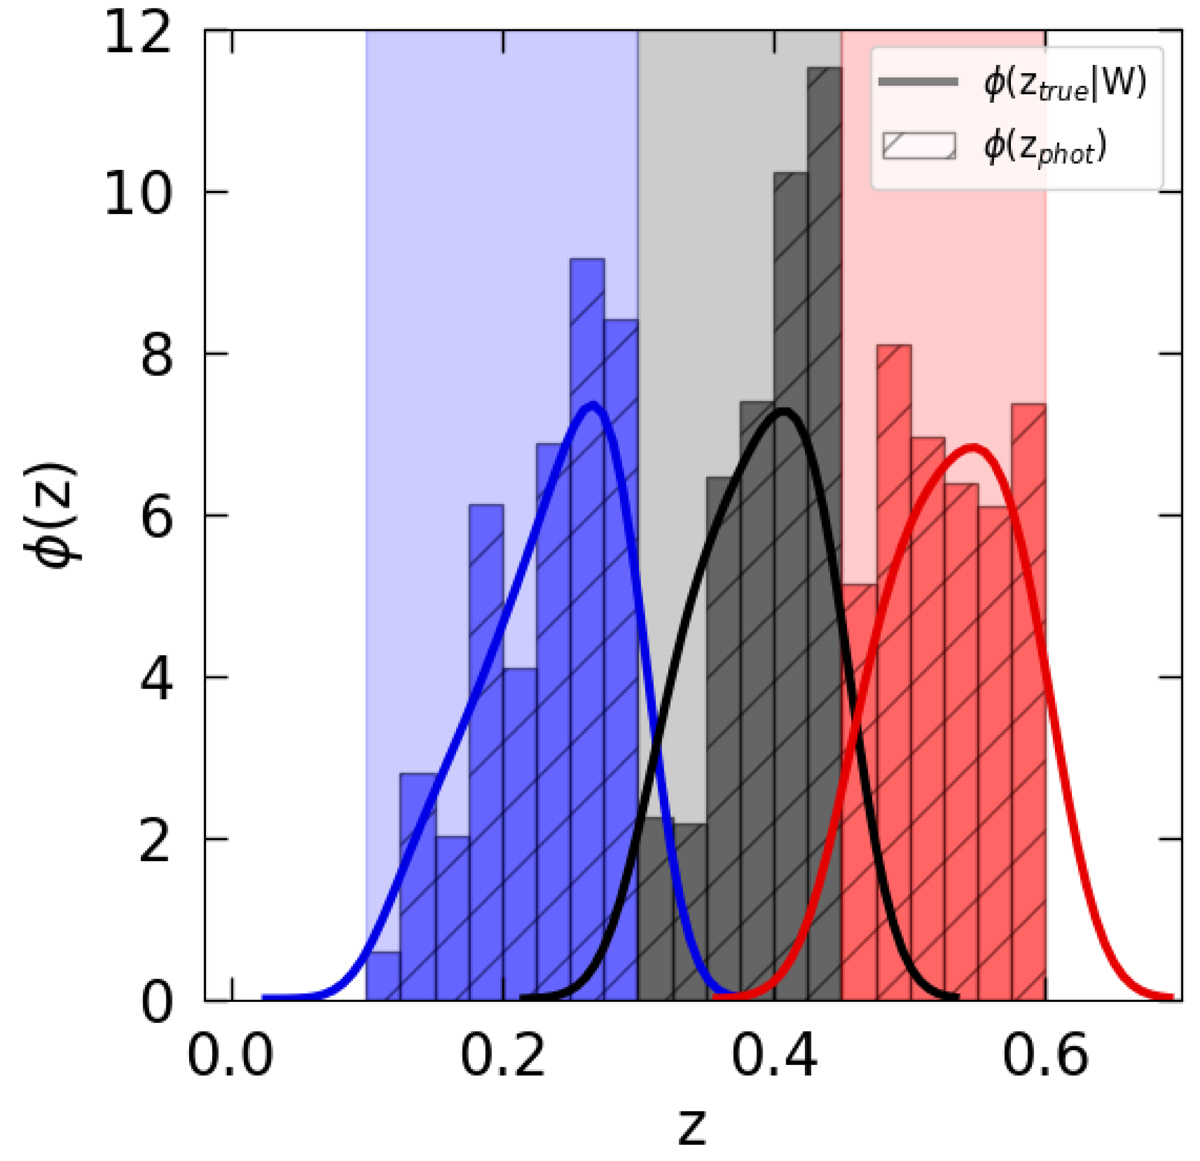
Normalised redshift distributions. The histograms represent ϕ(zphot), from the photometric cluster catalogue, while ϕ(ztrue|W) is predicted from Eq. (11), using the theoretical halo mass function model by Tinker et al. (2008), with cosmological parameters provided by Planck Collaboration VI (2020, along with Table 2, TT, TE, and EE+lowE), then convolved with our photometric window function, W. The shaded areas indicate the limits of our photometric redshift bins.
Current usage metrics show cumulative count of Article Views (full-text article views including HTML views, PDF and ePub downloads, according to the available data) and Abstracts Views on Vision4Press platform.
Data correspond to usage on the plateform after 2015. The current usage metrics is available 48-96 hours after online publication and is updated daily on week days.
Initial download of the metrics may take a while.