Fig. 8
Download original image
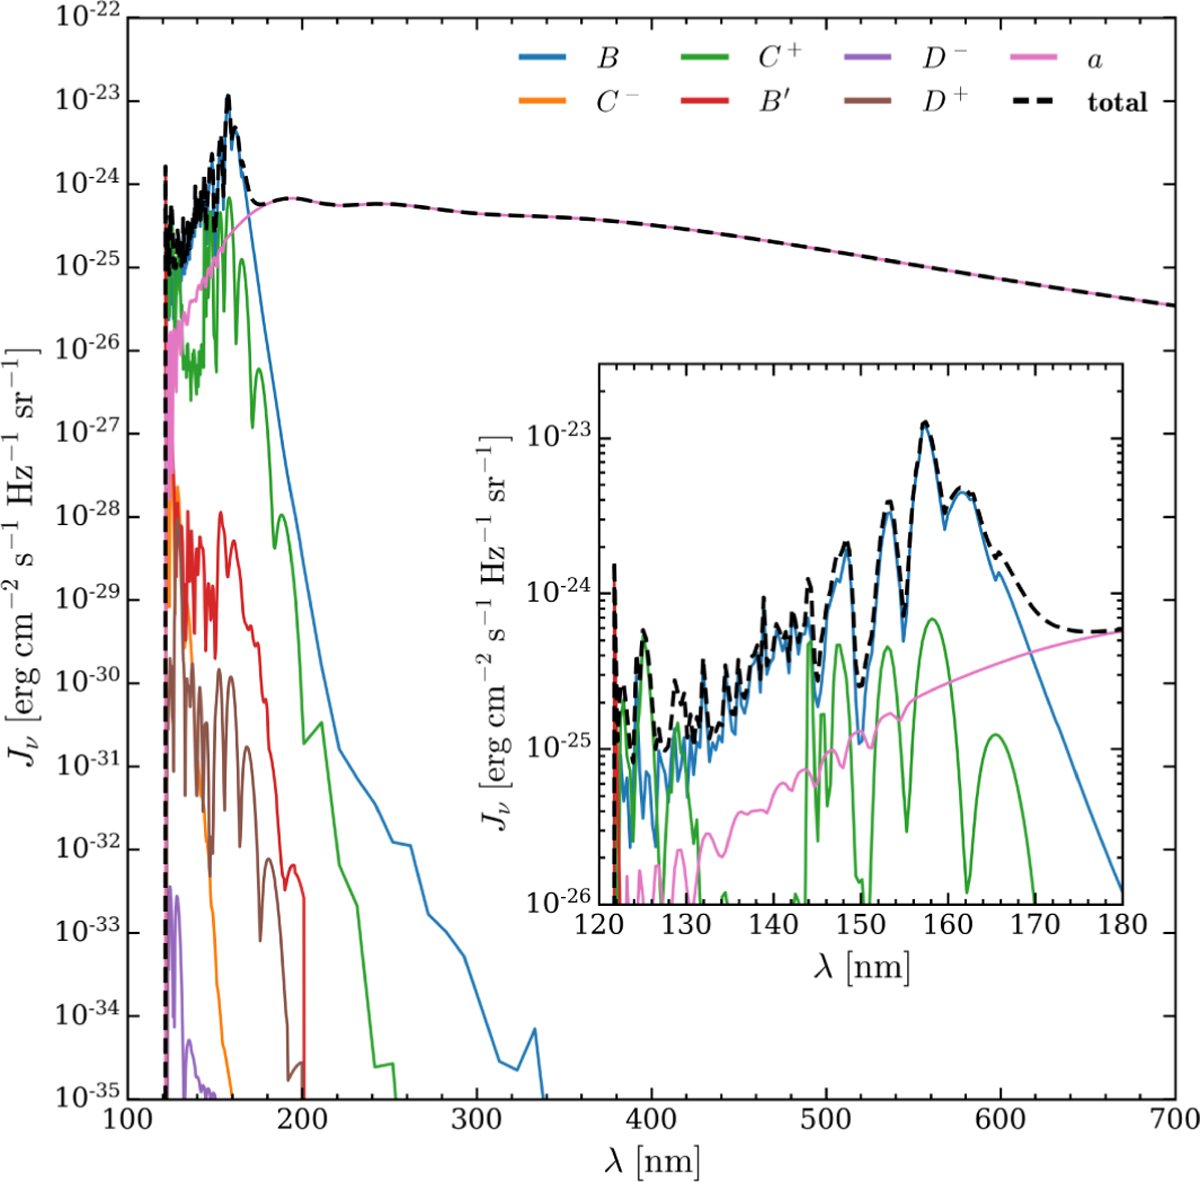
Mean intensity, Jv, of the continuum emission of H2 from excited electronic states as a function of wavelength, λ, for a molecular cloud with a column density N = 1023 cm−2 illuminated by one side. The contribution of each excited electronic state (solid lines) is shown by solid coloured lines, while the dashed black line shows the total continuum emission. The inset shows the emission in the range 120–180 nm. Results are shown for model ℋ, H2 o:p=0:1, and RV = 3.1.
Current usage metrics show cumulative count of Article Views (full-text article views including HTML views, PDF and ePub downloads, according to the available data) and Abstracts Views on Vision4Press platform.
Data correspond to usage on the plateform after 2015. The current usage metrics is available 48-96 hours after online publication and is updated daily on week days.
Initial download of the metrics may take a while.