Fig. 2
Download original image
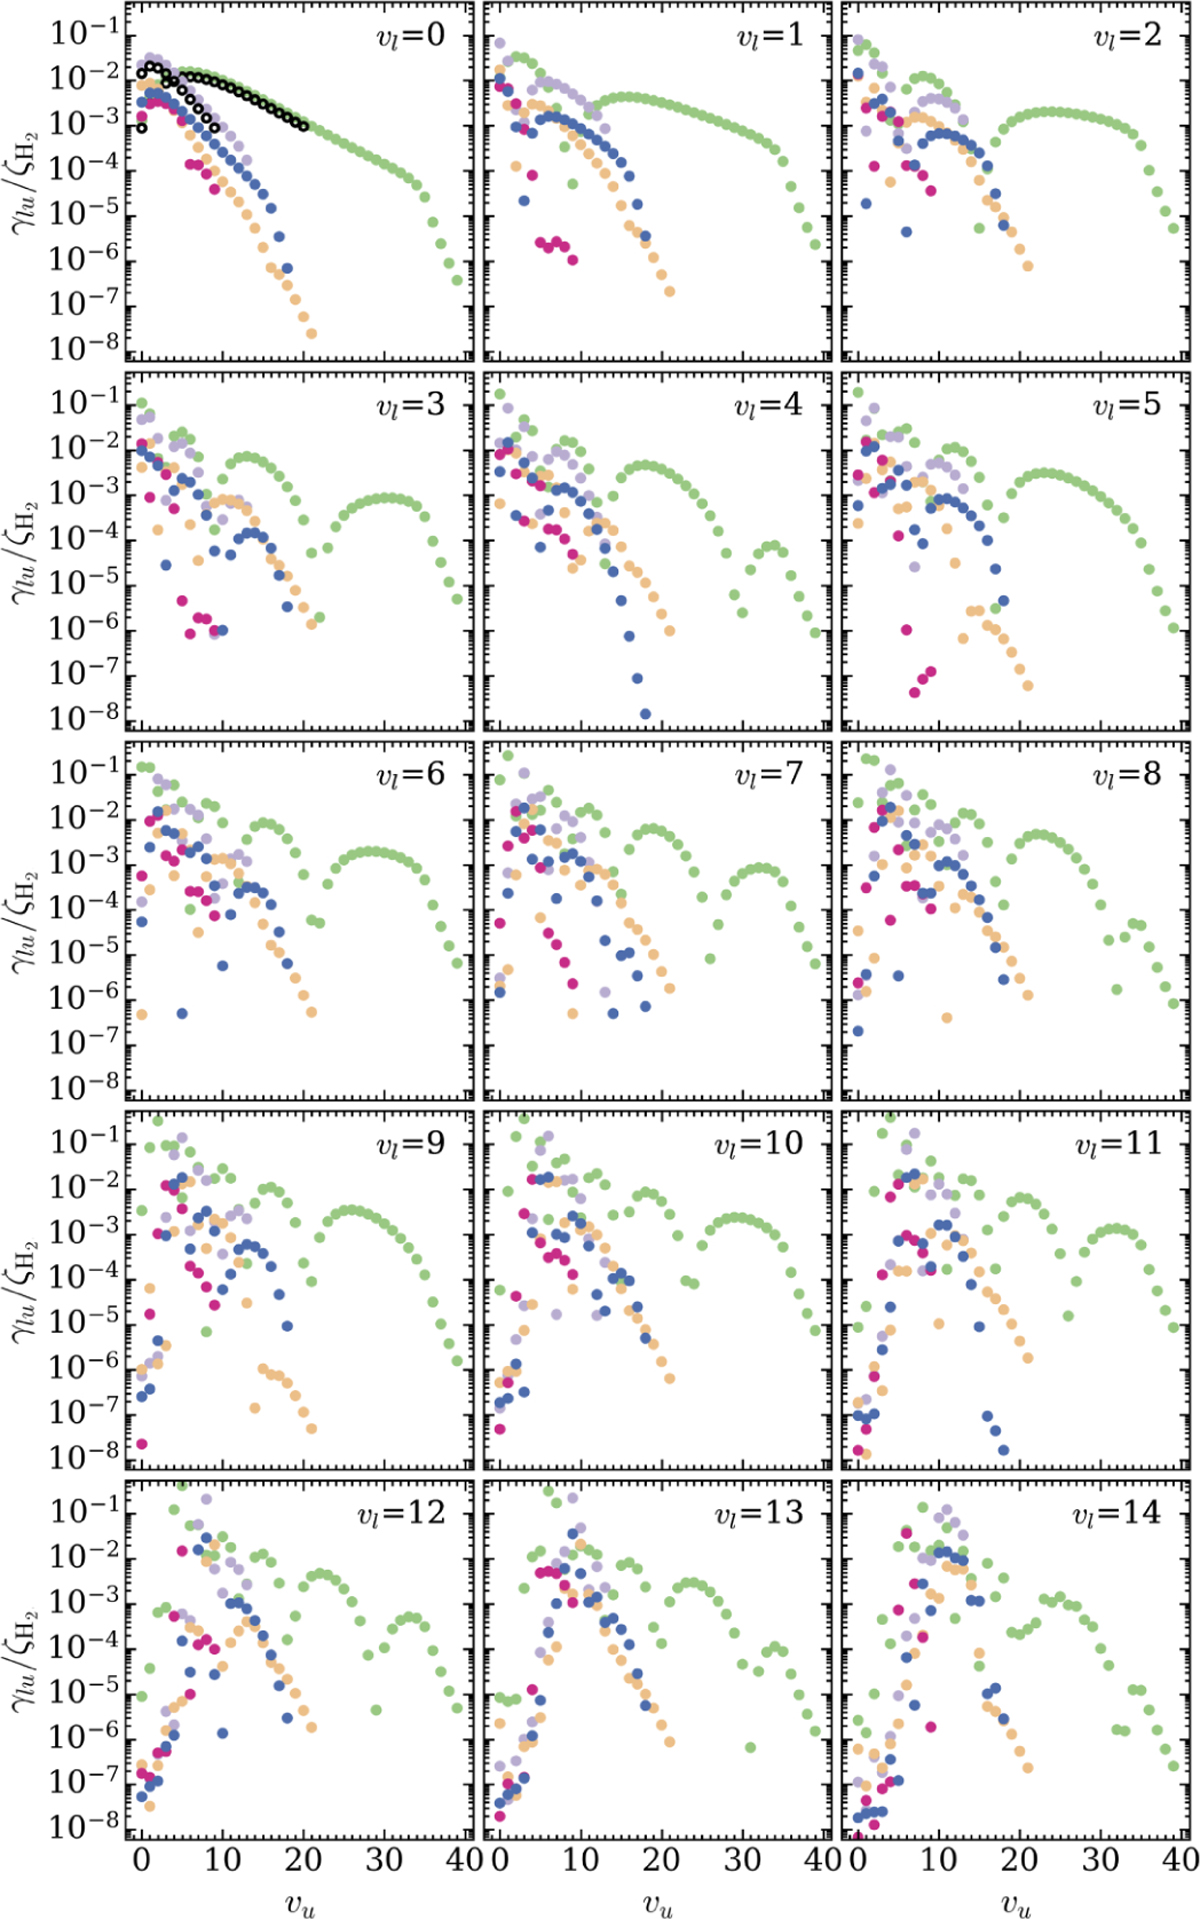
Ratio between the e-H2 excitation rates summed over the initial and final rotational states and the CR ionisation rate for model ℋ and N = 1020 cm−2 as a function of the upper vibrational level, vu. Each subplot shows results for a different lower vibrational level, vl. Solid green, violet, magenta, blue, and orange circles refer to the excitation of the B, C, B′, D, and a states from the ground state X, respectively. Empty black circles show a subset of previous estimates by Cecchi-Pestellini & Aiello (1992, see Sect. 3.5 for more details.)
Current usage metrics show cumulative count of Article Views (full-text article views including HTML views, PDF and ePub downloads, according to the available data) and Abstracts Views on Vision4Press platform.
Data correspond to usage on the plateform after 2015. The current usage metrics is available 48-96 hours after online publication and is updated daily on week days.
Initial download of the metrics may take a while.