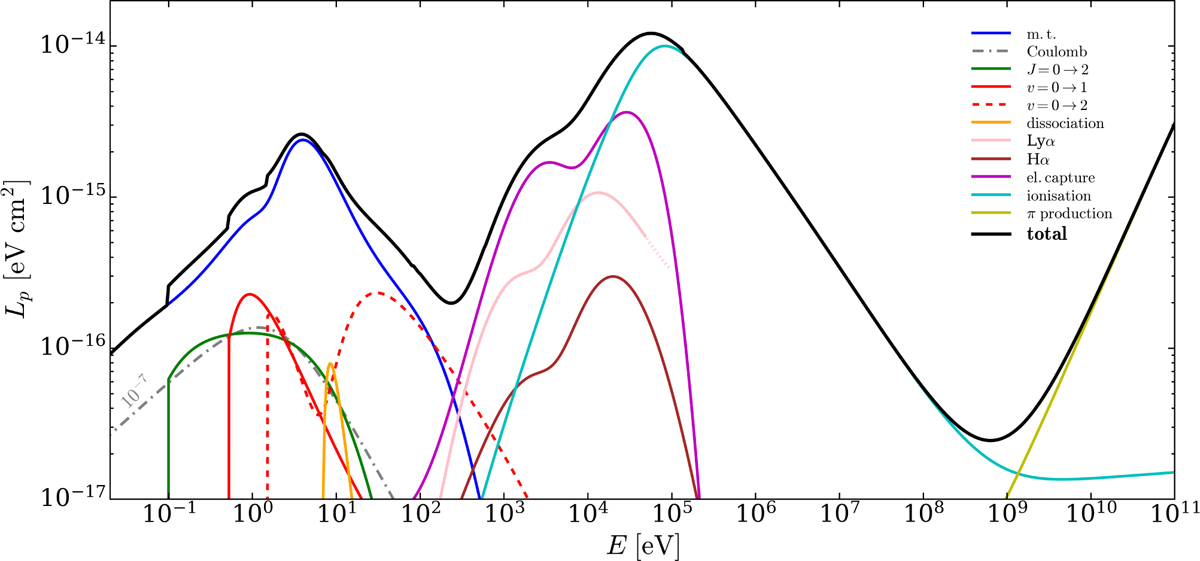
Fig. C.2
Download original image
Energy loss function for protons colliding with H2 (solid black line). Coloured lines show the different components and the following references point to the papers from which the relative cross sections have been adopted: momentum transfer (‘m.t.’, solid blue; Pinto & Galli 2008); the rotational transition J = 0 → 2 (solid green line; Gianturco & Tritella 1977; Linder 1980); vibrational transitions v = 0 → 1 and v = 0 → 2 (solid and dashed red lines, respectively; Gentry & Giese 1975; Herrero & Doering 1972; Schinke 1977; Niedner et al. 1987; Janev et al. 2003); dissociation (solid orange line; Janev et al. 2003); Lyα (solid pink line; van Zyl et al. 1967, 1989; Phelps 1990); Hα (solid brown line; Williams et al. 1982); electron capture (solid purple line; Gilbody & Hasted 1957; Curran et al. 1959; De Heer et al. 1966; Toburen & Wilson 1972; Rudd et al. 1983; Gealy & van Zyl 1987; Baer et al. 1988; Phelps 1990; Errea et al. 2010); ionisation (solid cyan line; Rudd 1988; Krause et al. 2015); and pion production (solid yellow line; Krakau & Schlickeiser 2015). Dash-dotted grey lines show the Coulomb losses at 10 K for an ionisation fraction of 10−7 (Mannheim & Schlickeiser 1994).
Current usage metrics show cumulative count of Article Views (full-text article views including HTML views, PDF and ePub downloads, according to the available data) and Abstracts Views on Vision4Press platform.
Data correspond to usage on the plateform after 2015. The current usage metrics is available 48-96 hours after online publication and is updated daily on week days.
Initial download of the metrics may take a while.