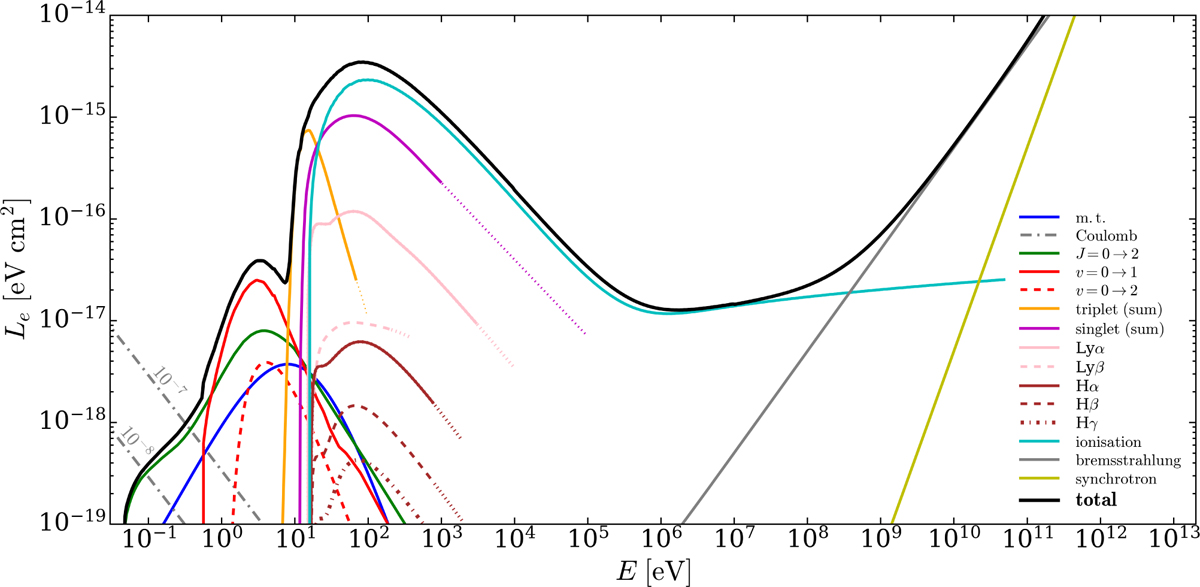
Fig. C.1
Download original image
Energy loss function for electrons colliding with H2 (solid black line). Coloured lines show the different components and the following references point to the papers from which the relative cross sections have been adopted: momentum transfer (‘m.t.’, solid blue; Pinto & Galli 2008); the rotational transition J = 0 → 2 (solid green line; England et al. 1988); vibrational transitions v = 0 → 1 (solid red line; Yoon et al. 2008) and v = 0 → 2 (dashed red line; Janev et al. 2003); electronic transitions summed over all the triplet and singlet states (solid orange and magenta lines, respectively; Scarlett et al. 2021); Lyman series (solid pink lines; van Zyl et al. 1989; Ajello et al. 1991, 1996); Balmer series (solid brown lines; Möhlmann et al. 1977; Karolis & Harting 1978; Williams et al. 1982); ionisation (solid cyan line; Kim et al. 2000); bremsstrahlung (solid grey line; Blumenthal & Gould 1970; Padovani et al. 2018a); and synchrotron (solid yellow line; Schlickeiser 2002). Dash-dotted grey lines show the Coulomb losses at 10 K for ionisation fractions equal to 10−7 and 10−8 (Swartz et al. 1971) and the solid yellow line shows the synchrotron losses (Schlickeiser 2002).
Current usage metrics show cumulative count of Article Views (full-text article views including HTML views, PDF and ePub downloads, according to the available data) and Abstracts Views on Vision4Press platform.
Data correspond to usage on the plateform after 2015. The current usage metrics is available 48-96 hours after online publication and is updated daily on week days.
Initial download of the metrics may take a while.