Fig. 11
Download original image
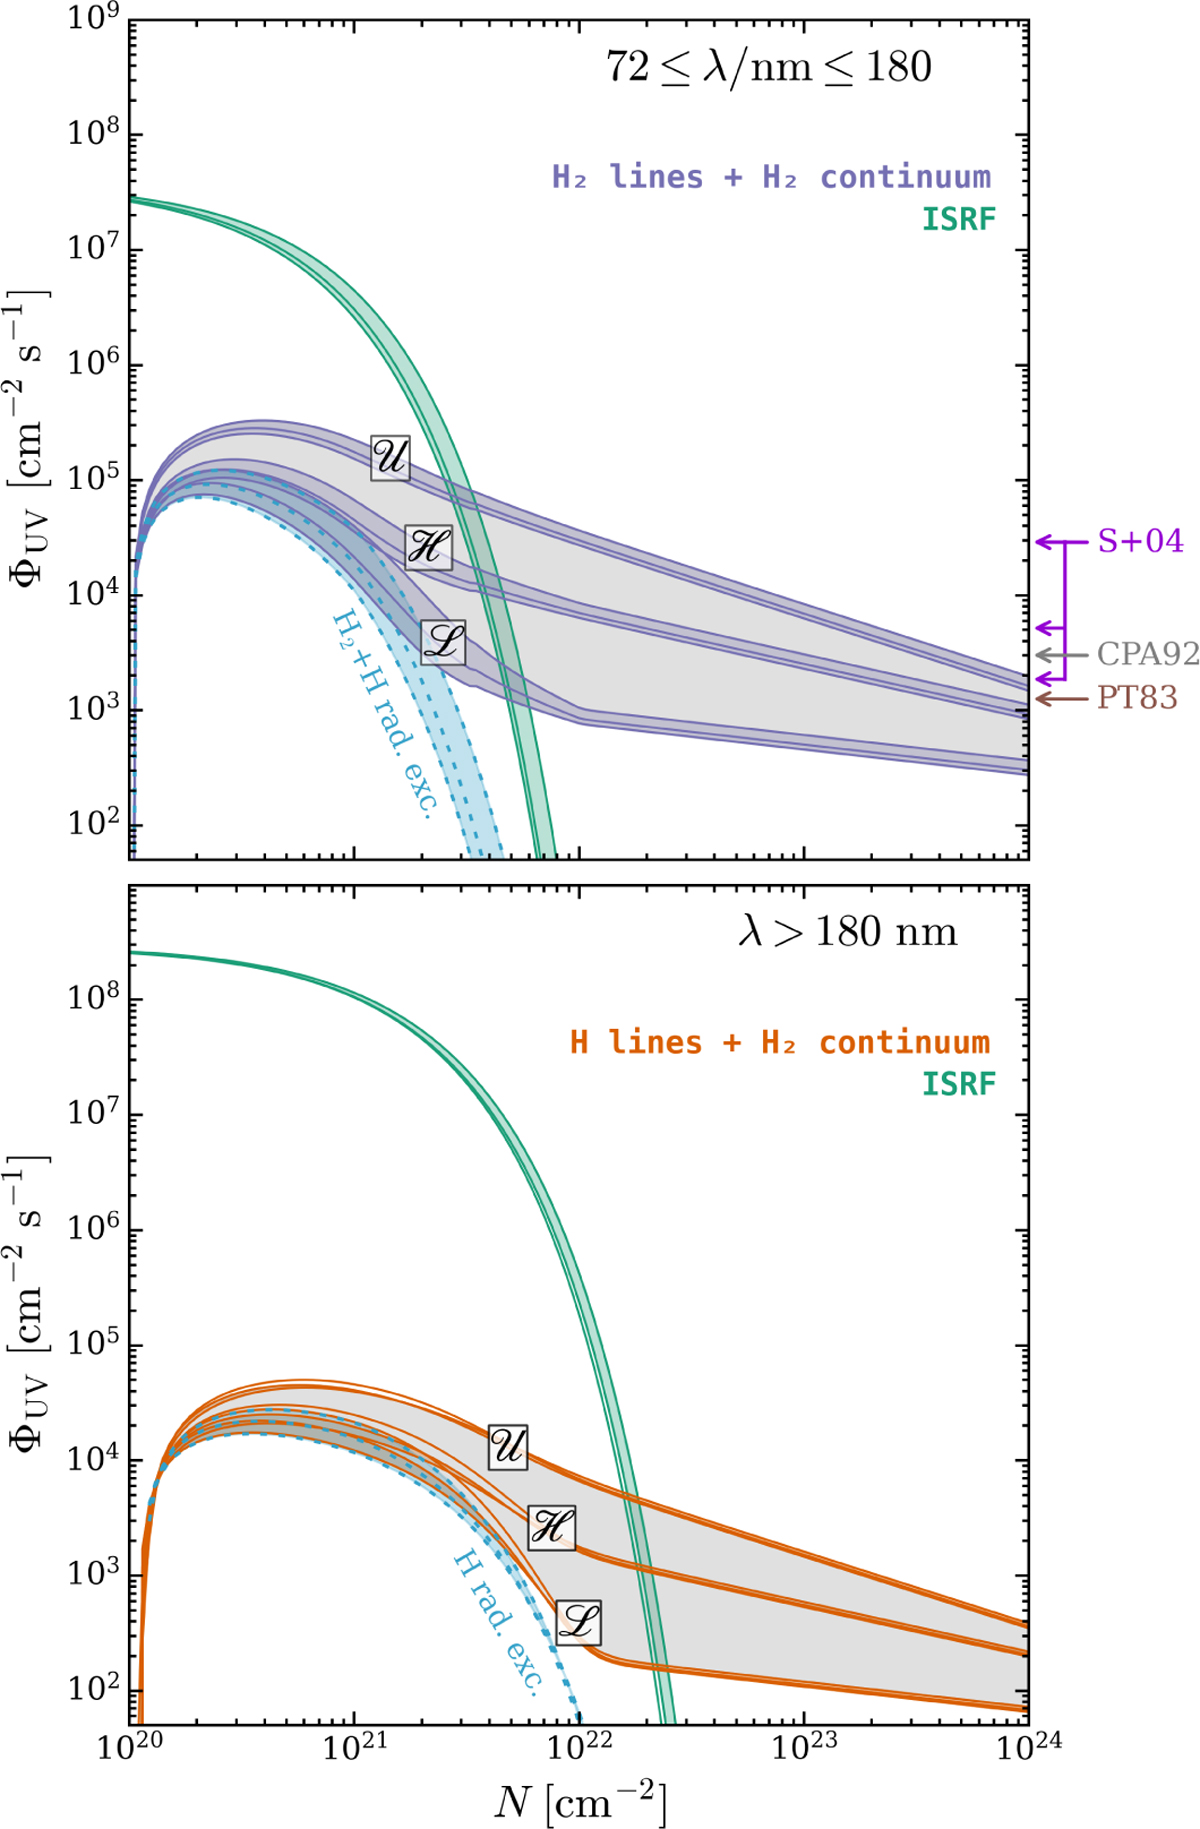
Photon fluxes, ΦUV, as a function of the H2 column density, N, below and above 180 nm (upper and lower panel, respectively) for χ = 1. Both panels show the integrated flux of CR-generated UV photons as a function of the three models of CR proton flux (ℒ, ℋ and 𝒰) and the ISRF UV flux. The cyan dotted lines show the integrated photon flux from H2 and Η lines generated by collisional radiative excitation (labelled 'rad. exc.'). The three curves for each model correspond to RV = 3.1 (lower curve), 4.0 (intermediate curve), and (5.5 upper curve). Arrows on the righthand side of the upper panel show previous estimates of ΦUV, independent of column density: Prasad & Tarafdar (1983, PT83), Cecchi-Pestellini & Aiello (1992, CPA92), and Shen et al. (2004, S+04).
Current usage metrics show cumulative count of Article Views (full-text article views including HTML views, PDF and ePub downloads, according to the available data) and Abstracts Views on Vision4Press platform.
Data correspond to usage on the plateform after 2015. The current usage metrics is available 48-96 hours after online publication and is updated daily on week days.
Initial download of the metrics may take a while.