Fig. 10
Download original image
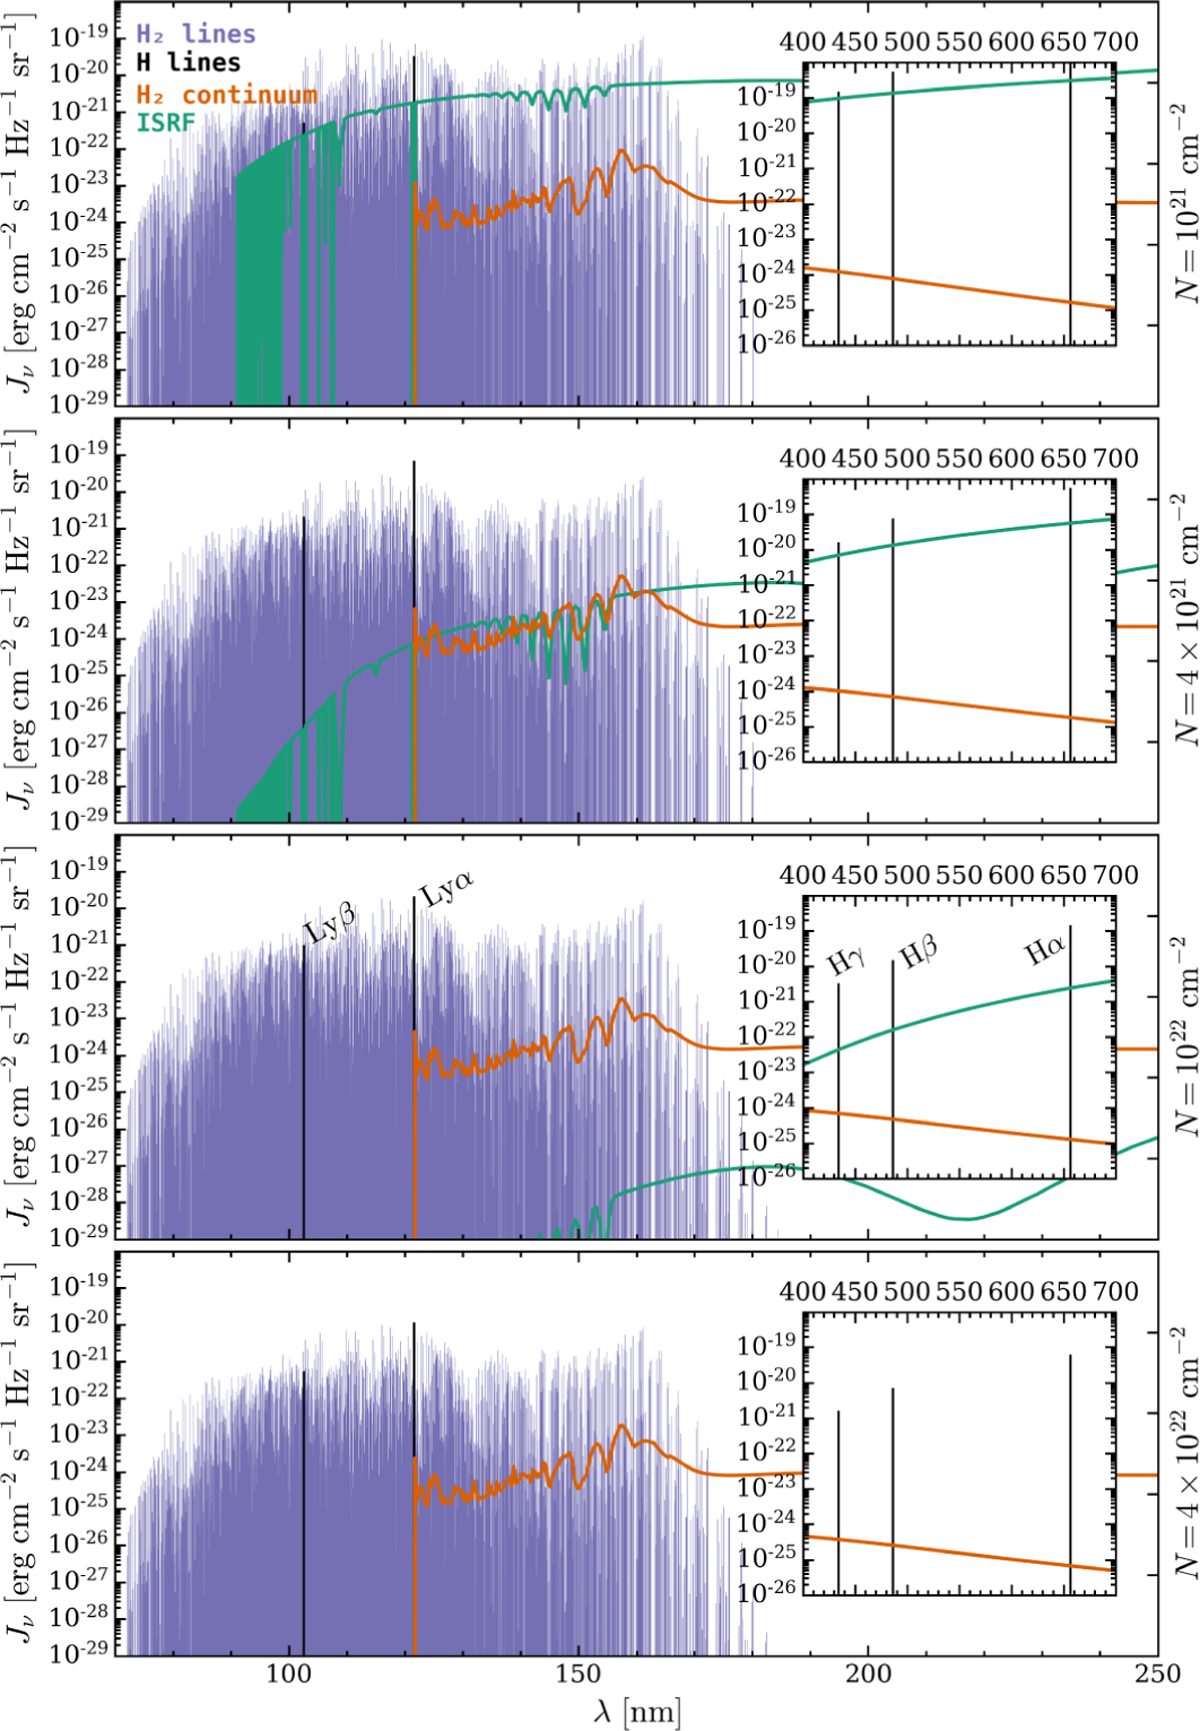
Mean intensity, Jv, of the total emission in the wavelength range 72 < λ/nm < 250 for a molecular cloud illuminated by one side. From top to bottom the four panels show the expected mean intensity from H2 lines, H2 continuum, H lines (Lyα and Lyβ), and ISRF at four different column densities, from N = 1021 to 4 × 1022 cm−2. Insets show the components of Jv at 400 < λ/nm < 700, highlighting three lines of the Balmer series (Hα, Hβ, and Hγ). Results are shown for model ℋ, χ = 1, H2o:p=0:1, and Rv = 3.1.
Current usage metrics show cumulative count of Article Views (full-text article views including HTML views, PDF and ePub downloads, according to the available data) and Abstracts Views on Vision4Press platform.
Data correspond to usage on the plateform after 2015. The current usage metrics is available 48-96 hours after online publication and is updated daily on week days.
Initial download of the metrics may take a while.