Fig. 4
Download original image
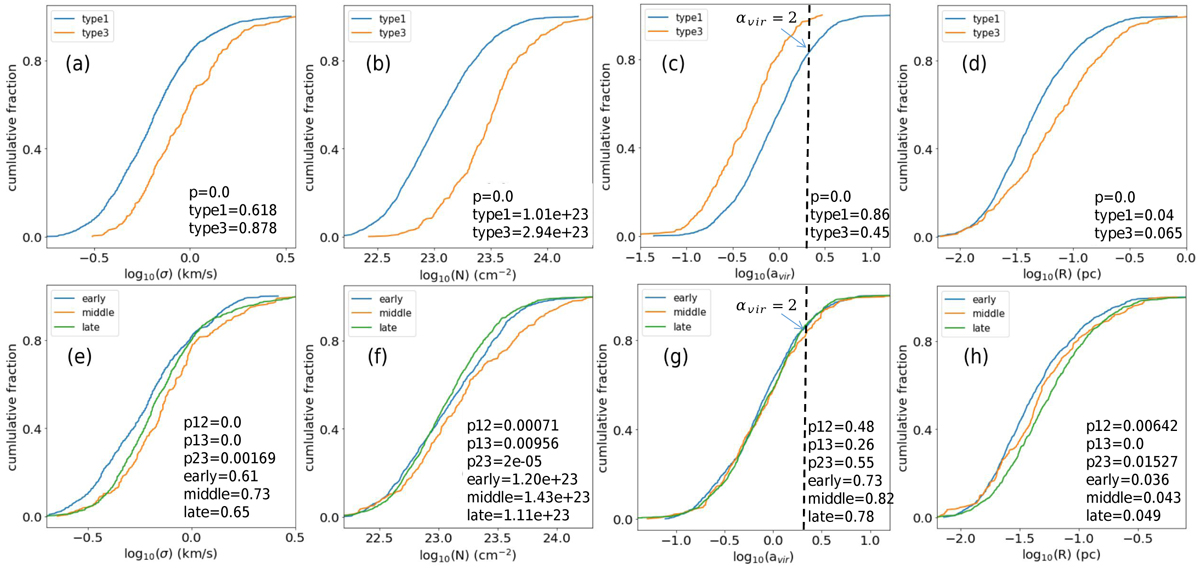
Physical properties of different structure types at different evolutionary stages. The first row is the comparison between type1 and type3 structures. The second row is the comparison between early, middle and late sources. The dashed lines in panels c and g mark the positions of αvir = 2. “p” is the p value of the Kolmogorov–Smirnov (KS) test. “p12,” “pl3,” and “p23” are the p values of KS tests between the structures inside early and middle sources, early and late sources, and middle and late sources, respectively. The median values also show in the legends.
Current usage metrics show cumulative count of Article Views (full-text article views including HTML views, PDF and ePub downloads, according to the available data) and Abstracts Views on Vision4Press platform.
Data correspond to usage on the plateform after 2015. The current usage metrics is available 48-96 hours after online publication and is updated daily on week days.
Initial download of the metrics may take a while.