Open Access
Fig. 1
Download original image
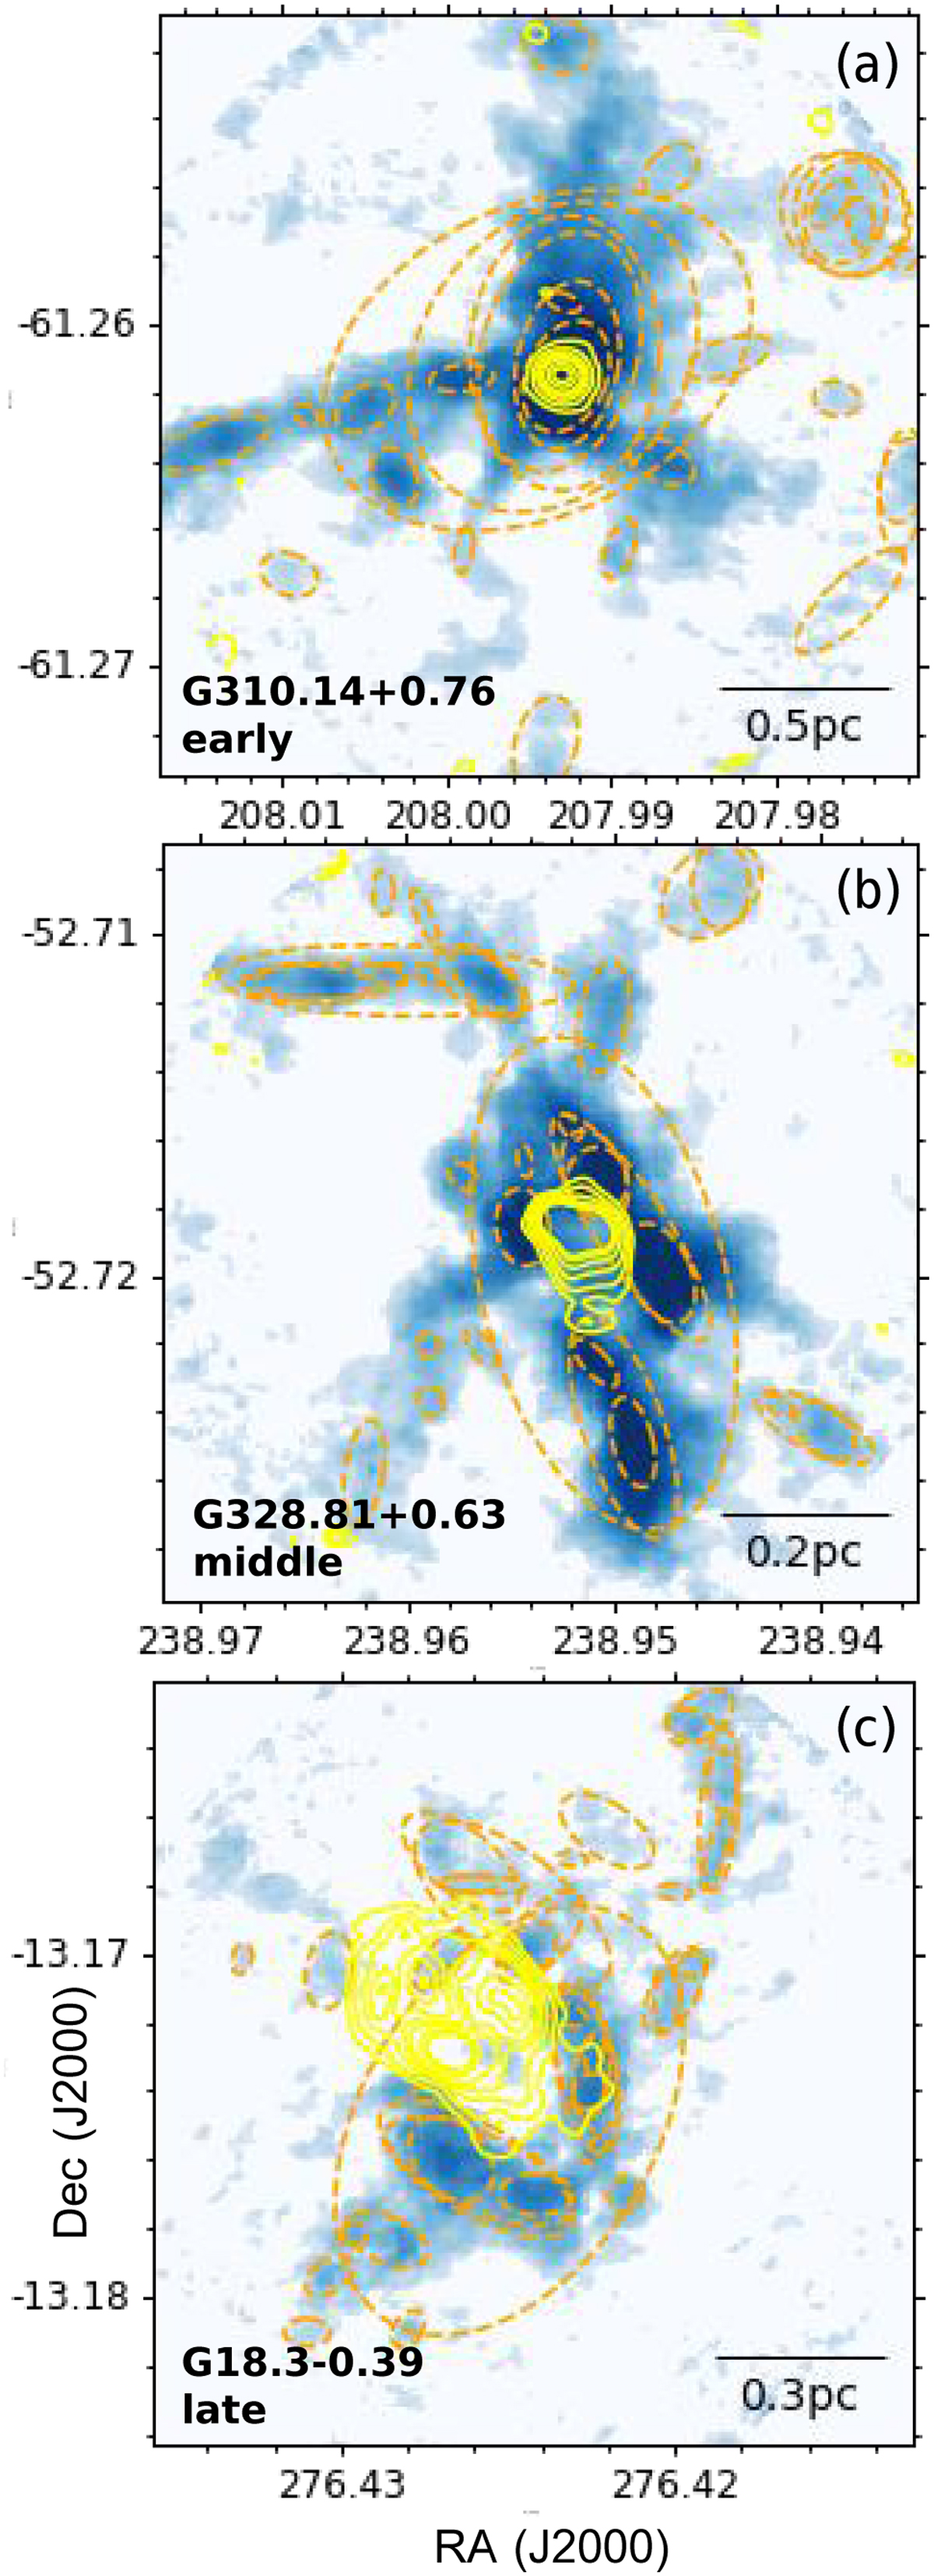
Moment 0 maps of H13CO+ J = 1−0 for three ATOMS sources at three evolutionary stages. Yellow contours show 3 mm continuum emission with its minimum contour level of 5σ. Orange eclipses represent the retained Dendrogram structures. The maps of all 64 ATOMS sources studied in this work are presented in Appendix B.
Current usage metrics show cumulative count of Article Views (full-text article views including HTML views, PDF and ePub downloads, according to the available data) and Abstracts Views on Vision4Press platform.
Data correspond to usage on the plateform after 2015. The current usage metrics is available 48-96 hours after online publication and is updated daily on week days.
Initial download of the metrics may take a while.