Fig. 8
Download original image
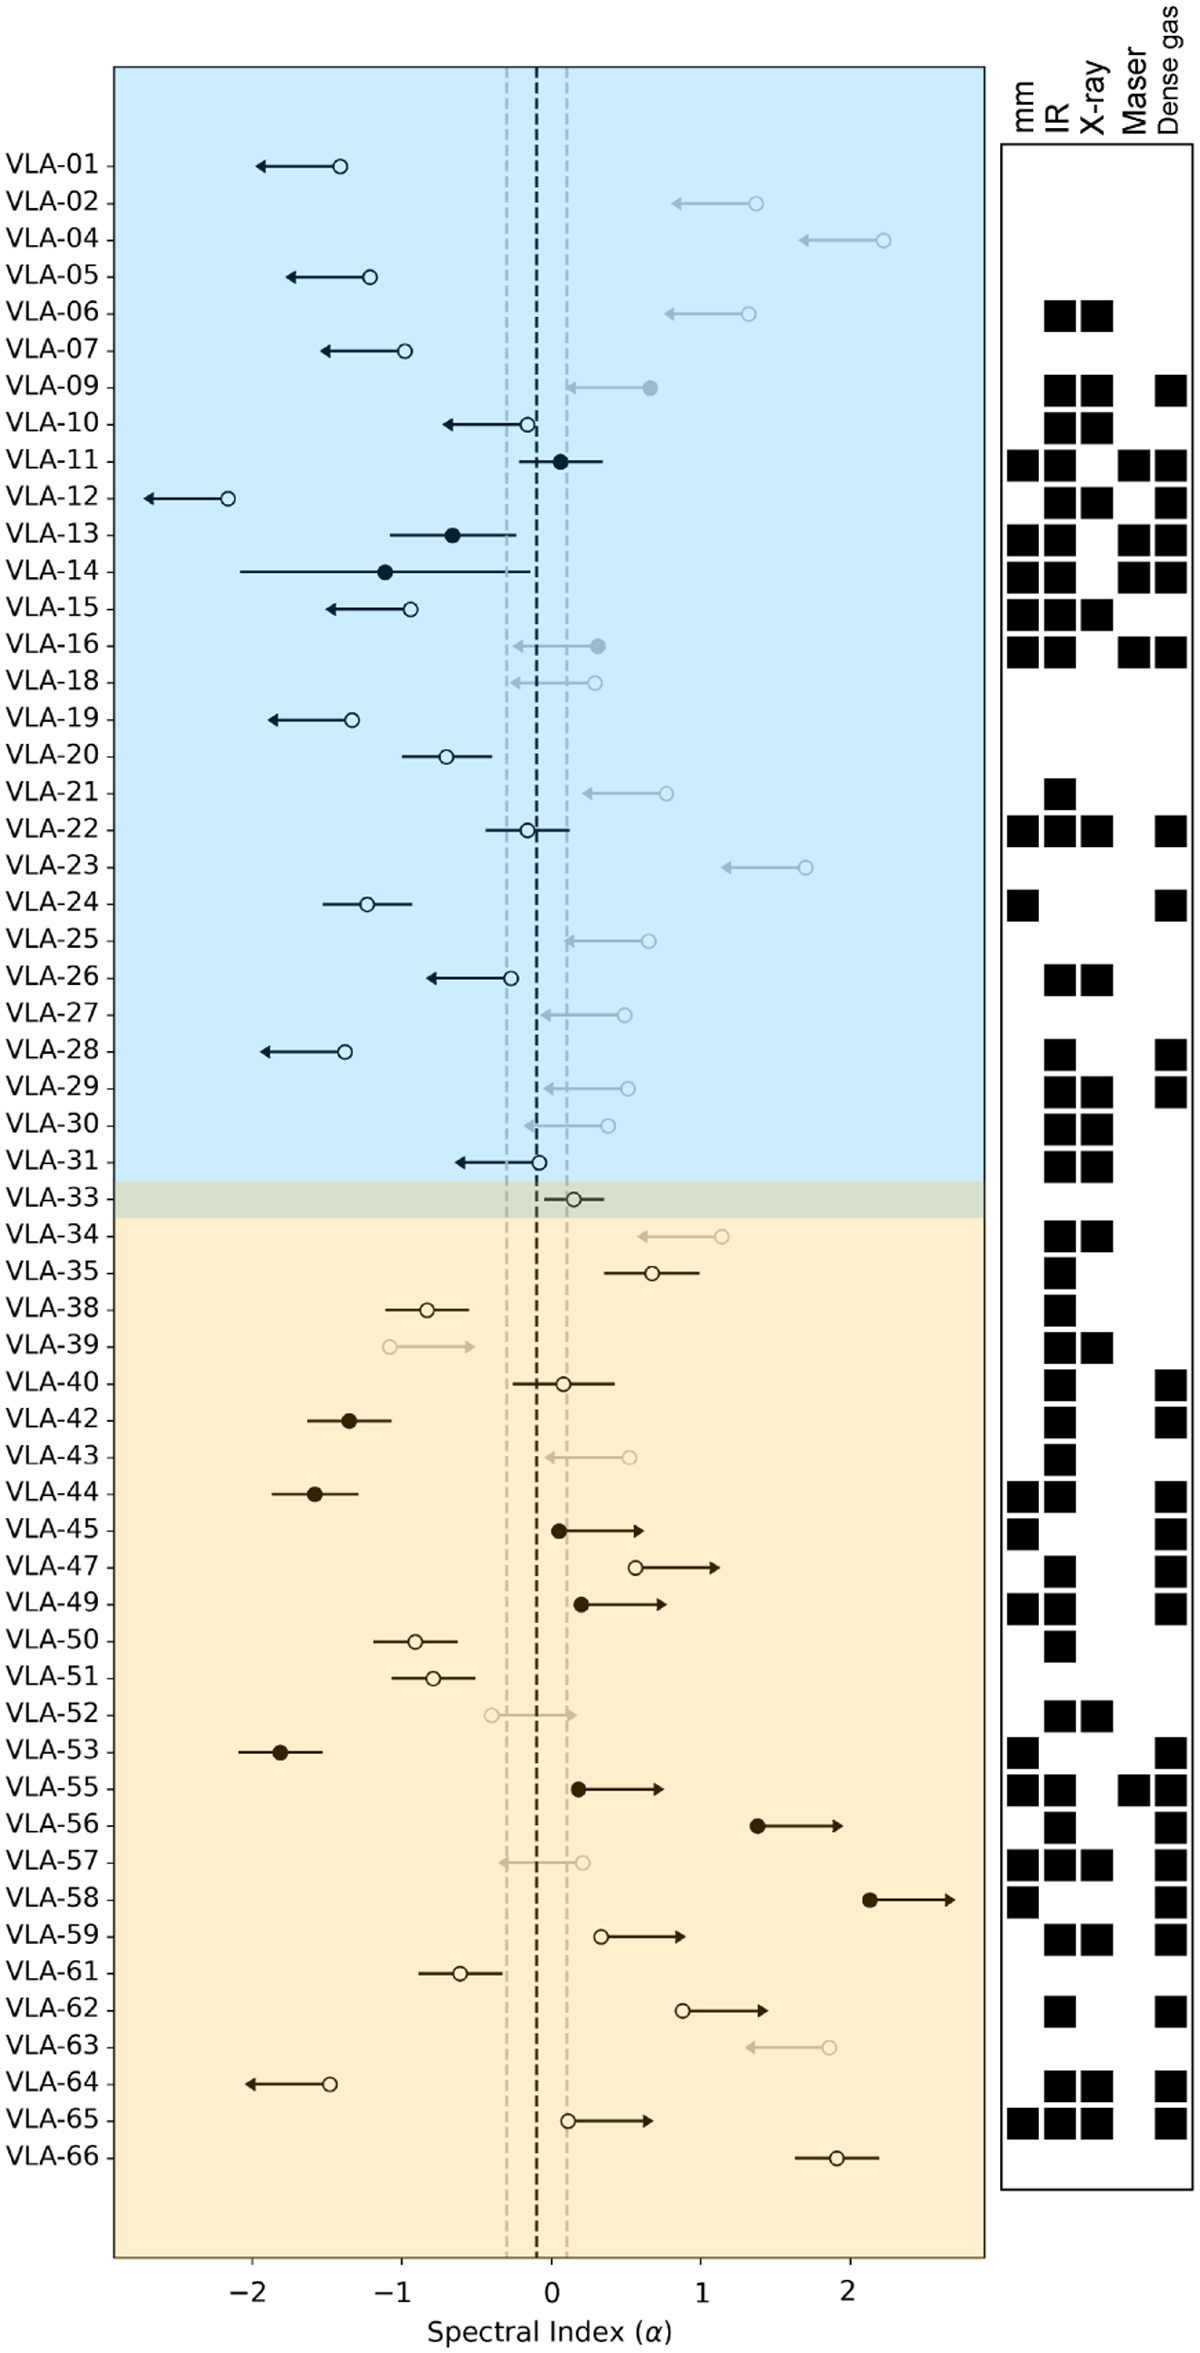
Spectral index of the sources detected in G14.2. Filled and open symbols denote sources located within the 0.4 pc inner region (i.e., hubs) or outside the 0.4 pc inner region, respectively. Black symbols represent those sources for which it has been possible to determine the origin of the radio continuum emission. Gray symbols represent those sources for which it has not been possible to infer its nature. Arrows denote upper or lower limits for those sources only detected in one frequency band. Variable sources have been excluded for this representation. The black dashed line at –0.1 draws the boundary between thermal emission (α > –0.1) and nonthermal emission (α < –0.1). The gray dashed lines trace the limits where sources show a nearly flat spectrum, probably associated with thermal emission. The blue- and orange-shaded regions represent G14.2-N and G14.2-S, respectively. The right black panels indicate if the sources present a reported counterpart at mm, IR and/or X-ray, associated maser emission and/or dense gas emission.
Current usage metrics show cumulative count of Article Views (full-text article views including HTML views, PDF and ePub downloads, according to the available data) and Abstracts Views on Vision4Press platform.
Data correspond to usage on the plateform after 2015. The current usage metrics is available 48-96 hours after online publication and is updated daily on week days.
Initial download of the metrics may take a while.